USA100 Weekly Special Report based on 1.00 Lot Calculation:
- WHAT IS A STOCK INDEX: According to Investopedia.com, a stock index measures the price performance of a basket (group) of stocks using a standardized methodology. The NASDAQ 100 Index is one of the world's best-known indexes and one of the most commonly used benchmarks for the stock market.
- COMPONENTS: USA100 includes 100 companies including Amazon, Google, Nvidia, Meta, and Microsoft.
ANALYSIS:
- THE NASDAQ, THE MARKET NOW UP MORE THAN 80% FROM ITS OCTOBER 2022 LOWS: The Nasdaq has sharply rallied from October 2022 lows, as the tech sector continues to remain the best performing sector in the United States. The Nasdaq rally has outpaced both the S&P500 and the Dow Jones Industrial index since October 2022.
STATISTICS:
- LAST SEVEN QUARTERLY EARNINGS SEASONS: THE ARTIFICIAL INTELLIGENCE (A.I.) EUPHORIA HAS CREATED ON AVERAGE A 4.95% INCREASE FOR THE USA100 DURING THE EARNINGS SEASONS. The table below illustrates price reactions of the three major US stock indices. On average, the USA100 index has risen by 4.95% each quarterly earnings season since Q3 2022. Over the same period, the USA500 index rose 3.68%, while the USA30 index climbed around 3.34%. NEXT (Q2) EARNINGS SEASON: JULY 15 – AUGUST 15, 2024.
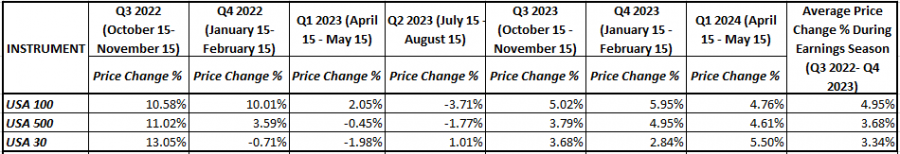
Data Source: MetaTrader 4 Platform
Please note that past performance does not guarantee future results
- USA100: JULY PERFORMANCE (2015 – 2023): THE USA100 ROSE ON AVEARGE 4.66% EACH JULY SINCE 2015
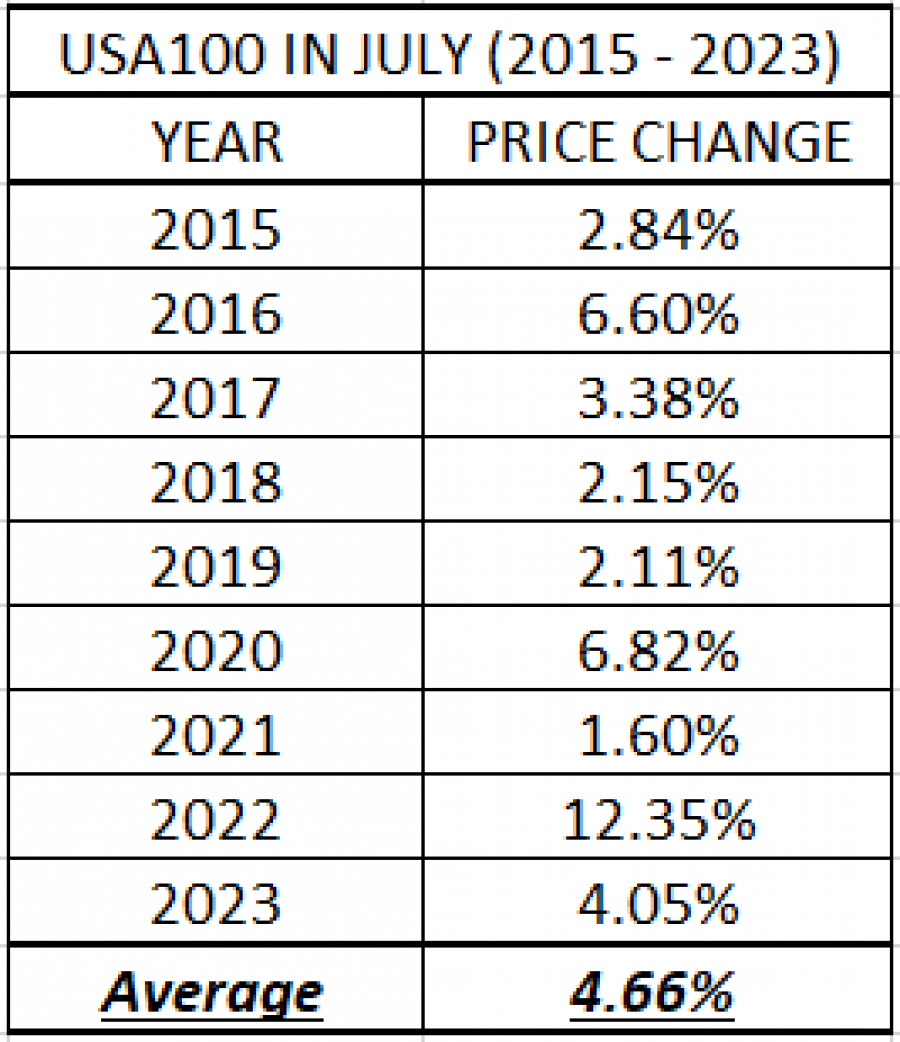
Data Source: Bloomberg
Please note that past performance does not guarantee future results
NEXT EVENTS:
- THURSDAY, JULY 11 AT 13:30 GMT+1: US INFLATION (CPI) (JUNE). The United States will be reporting CPI data. The US CPI has been trending lower, well below its 2022 peak of 9.1%. The most recent print showed CPI at 3.3%. Should the CPI come in lower than expected, US stock prices could move higher on dovish expectations.
- THURSDAY, JULY 25 AT 13:30 GMT+1: US GROSS DOMESTIC PRODUCT (GDP) (Q2) (first preliminary data). The US Economy grew by 1.4% in Q1 of 2024, down from Q4 of 2023 of 3.4%. If the trend continues on, the US Fed might be encouraged to act and sooner than later decide to cut its benchmark interest rate in order to support growth. This could potentially support the US stock prices.
- WEDNESDAY, JULY 31 AT 19:00 GMT+1: US FDERAL RESERVE INTEREST RATE DECISION. Federal Reserve Bank will meet on July 31, to set the Fed Funds rate target. According to the most recent estimates, some analysts are expecting the Federal Reserve to hold interest rates at the current level of 5.50%, but chances have been rising for a September cut.
USA100, JULY 9, 2024
Current Price: 20,700
|
USA100 |
Weekly |
|
Trend direction |
|
|
22,500 |
|
|
22,000 |
|
|
21,500 |
|
|
20,000 |
|
|
19,800 |
|
|
19,600 |
Example of calculation base on weekly trend direction for 1.00 Lot1
|
USA100 |
||||||
|
Profit or loss in $ |
18,000 |
13,000 |
8,000 |
-7,000 |
-9,000 |
-11,000 |
|
Profit or loss in €² |
16,629 |
12,010 |
7,391 |
-6,467 |
-8,314 |
-10,162 |
|
Profit or loss in £² |
14,042 |
10,141 |
6,241 |
-5,461 |
-7,021 |
-8,581 |
|
Profit or loss in C² |
24,546 |
17,728 |
10,909 |
-9,546 |
-12,273 |
-15,000 |
1. 1.00 lot is equivalent of 10 units
2. Calculations for exchange rate used as of 11:30 (GMT+1) 09/07/2024
There is a possibility to use Stop-Loss and Take-Profit.
- You may wish to consider closing your position in profit, even if it is lower than suggested one.
- Trailing stop technique could protect the profit.