USA100 Weekly Special Report based on 1.00 Lot Calculation:
USA100:
- USA100 represents the Nasdaq 100, which includes 100 of the largest and most innovative non-financial companies listed on the Nasdaq exchange. It features global tech and AI leaders such as Apple, Google, Tesla, Nvidia, Meta, Microsoft, Amazon, and others. In essence, USA100 reflects the strength and evolution of the modern digital economy in the United States.
HOLIDAY SEASON: NOVEMBER TENDS TO SEE STRONGER USA100
- 2025 HOLIDAY SEASON EVENTS:
- Thanksgiving (Thursday, November 27) - A major U.S. holiday marking the start of the festive shopping period and increased consumer activity.
- Black Friday (Friday, November 28) - The biggest retail shopping day of the year, known for steep discounts that drive massive in-store and online sales.
- Cyber Monday (Monday, December 1) - The peak online shopping day following Black Friday, boosting e-commerce sales.
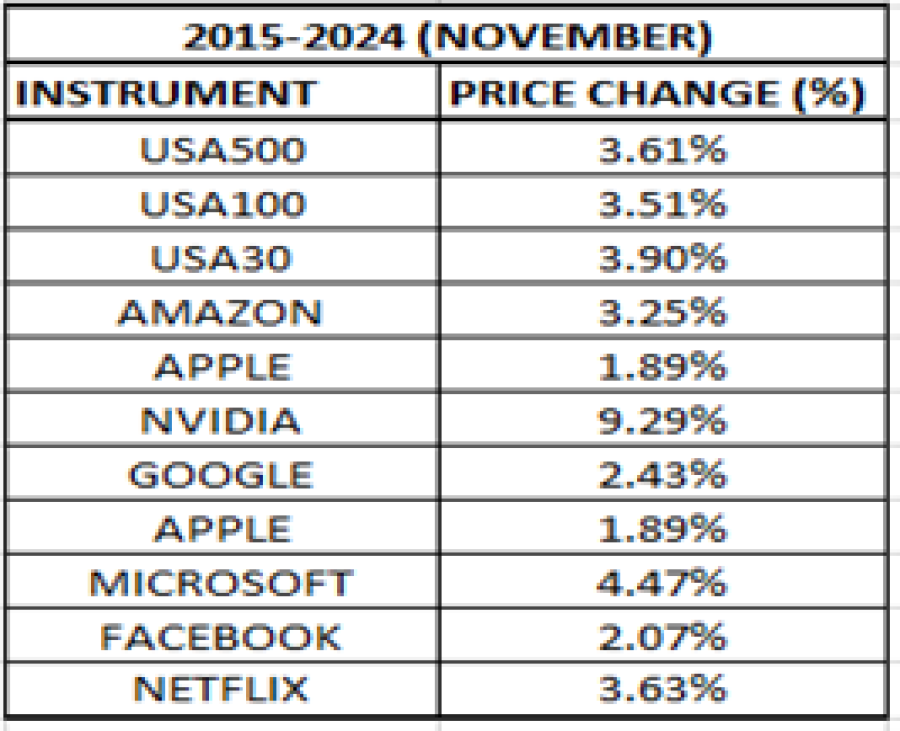
- HISTORICAL TREND (2015–2024): USA100 PRICE ROSE ON AVERAGE 3.51% IN NOVEMBER OVER THE LAST 10 YEARS. The USA100 has shown strength during November, averaging a 3.51% gain over the past decade, supported by upbeat earnings from major tech giants and increased investor optimism heading into the holiday shopping season.
INDIVIDUALS STOCKS: Leading USA100 components such as NVIDIA (+9.29%), Microsoft (+4.47%), and Netflix (+3.63%) have historically delivered positive November performances.
- HISTORICAL TREND (2020–2024): USA100 PRICE ROSE ON AVERAGE 6.38% IN NOVEMBER OVER THE LAST 5 YEARS. According to YahooFinance data, the USA100 rose +10.68% (2020), +1.45% (2021), +6.56% (2022), +8.75% (2023) and +4.45% (2024). It gives an average increase of 6.38% for the past 5 years.
Data Source: YahooFinance.com
Please note that past performance does not guarantee future results
TECHNICAL ANALYSIS:
- DAILY MOVING AVERAGES: USA100 has remained above the 50-, and 100-day moving averages, pointing to a positive trend. However, USA100 could also change its trend if prices fall below the 50-, and 100-day moving averages.
- UPTREND IN 2025: USA100 has remained in an uptrend, as depicted by the orange line on the daily graph below. However, there remains a risk of a potential breakout below the orange uptrend line if market conditions change.
- PRICE ACTION: USA100 PRICE HAS RISEN AROUND 20.8% SINCE THE START OF 2025. However, it could also decline.
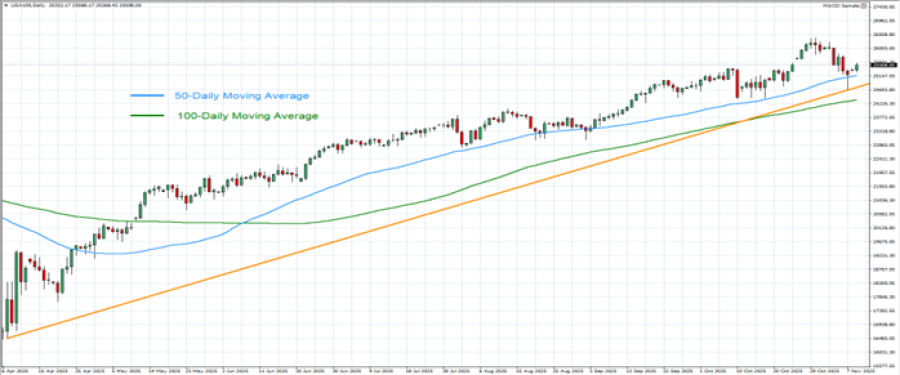
GRAPH (Daily): April 2025 – November 2025
Please note that past performance does not guarantee future results
#USA100, November 10, 2025.
Current Price: 25,500
|
USA100 |
Weekly |
|
Trend direction |
|
|
28,000 |
|
|
27,300 |
|
|
26,300 |
|
|
24,800 |
|
|
24,600 |
|
|
24,400 |
Example of calculation based on weekly trend direction for 1.00 Lot1
|
USA100 |
||||||
|
Pivot Points |
||||||
|
Profit or loss in $ |
25,000 |
18,000 |
8,000 |
-7,000 |
-9,000 |
-11,000 |
|
Profit or loss in €² |
21,625 |
15,570 |
6,920 |
-6,055 |
-7,785 |
-9,515 |
|
Profit or loss in £² |
19,002 |
13,682 |
6,081 |
-5,321 |
-6,841 |
-8,361 |
|
Profit or loss in C$² |
35,041 |
25,230 |
11,213 |
-9,811 |
-12,615 |
-15,418 |
- 1.00 lot is equivalent of 10 units
- Calculations for exchange rate used as of 11:20 (GMT) 10/11/2025
There is a possibility to use Stop-Loss and Take-Profit
- You may wish to consider closing your position in profit, even if it is lower than the suggested one.
- Trailing stop technique could protect the profit