USA100 Weekly Special Report based on 1.00 Lot Calculation:
USA100:
- USA100 represents the Nasdaq 100, which includes 100 of the largest and most innovative non-financial companies listed on the Nasdaq exchange. It features global tech and AI leaders such as Apple, Google, Tesla, Nvidia, Meta, Microsoft, Amazon, and others. In essence, USA100 reflects the strength and evolution of the modern digital economy in the United States.
HOLIDAY SEASON (SANTA CLAUS RALLY):
- EVENT (FINAL WEEKS OF DECEMBER): SANTA CLAUS RALLY. The Santa Claus rally is a period when the stock market tends to rise, usually occurring during the last five trading days of the year and the first two of the new year. For USA100, this runs from the opening bell on December 24th until the second trading day of 2026, January 5th.
- WHY IT OCCURS? The rally happens because of positive consumer and investor sentiment, holiday spending, and optimism for the new year. Many investors feel confident and make adjustments to their portfolios, which can push prices higher.
Please note that past performance does not guarantee future results
US FEDERAL RESERVE:
- BREAKING (DECEMBER 10): US FEDERAL RESERVE CUT INTEREST RATE TO 3.75% FROM 4.00%. The Fed cut rates again in December, and October after the one earlier in September. In total, this year, rates have fallen from 4.50% to the current 3.75%.
- MARKET EXPECTATIONS (2026): TOTAL CUTS BY YEAR END (2026): TWO (ONE CUT OF AT LEAST 25 BPS). Interest rates should come down from 3.75% to 3.25% by the end of 2026 (76.6%). NEXT RATE CUT ESTIMATED IN 2026 (MARCH 18: 56.8%).
EVENTS:
- WEDNESDAY, DECEMBER 24 AT 13:30 GMT: US INITIAL JOBLESS CLAIMS. Higher-than-expected jobless claims would suggest cooling labor market conditions, reinforcing expectations for Fed interest rate cuts and potentially supporting higher USA100 prices.
PRICE ACTION:
- USA100 HIT A FRESH ALL-TIME HIGH ON OCTOBER 30 (26,397.93). USA100 was last trading around 25,700, and if a full recovery to the recent all-time high takes place, it could see an upside potential of around 2.70%. However, the USA100 price could decline.
- USA100 HAS RISEN AROUND 21% IN 2025. The USA100 price has remained in a positive trend in 2025, as it has risen around 21% since the beginning of the year.
TECHNICAL ANALYSIS:
- DAILY MOVING AVERAGES: USA100 has remained above the 20-, 50-, and 100-daily moving averages. However, USA100 can also change its trend if prices fall below the 20-, 50-, and 100-daily moving averages.
- UP-TREND SINCE NOVEMBER 2025: USA100 has remained above the orange uptrend line since November 2025, confirming the bullish trend, though a breakout below the line remains a risk if market conditions shift.
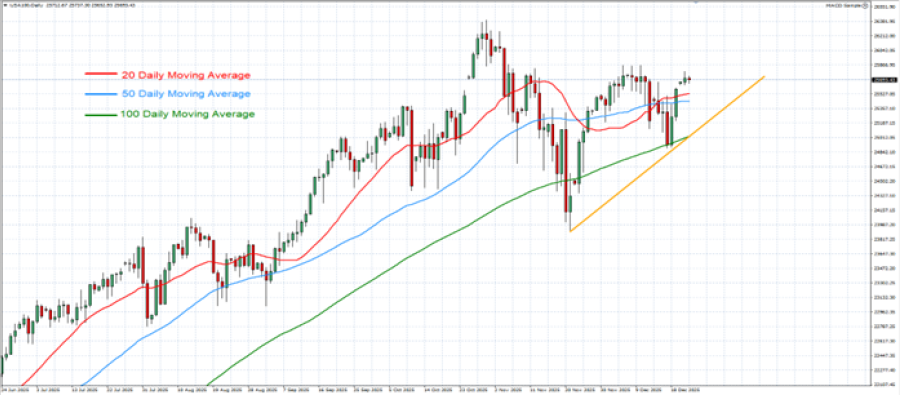
GRAPH (Daily): June 2025 – December 2025
Please note that past performance does not guarantee future results
#USA100, December 23, 2025.
Current Price: 25,700
|
USA100 |
Weekly |
|
Trend direction |
|
|
27,500 |
|
|
27,000 |
|
|
26,500 |
|
|
25,100 |
|
|
25,000 |
|
|
24,900 |
Example of calculation based on weekly trend direction for 1.00 Lot1
|
USA100 |
||||||
|
Pivot Points |
||||||
|
Profit or loss in $ |
18,000 |
13,000 |
8,000 |
-6,000 |
-7,000 |
-8,000 |
|
Profit or loss in €² |
15,261 |
11,022 |
6,783 |
-5,087 |
-5,935 |
-6,783 |
|
Profit or loss in £² |
13,325 |
9,623 |
5,922 |
-4,442 |
-5,182 |
-5,922 |
|
Profit or loss in C$² |
24,669 |
17,817 |
10,964 |
-8,223 |
-9,594 |
-10,964 |
- 1.00 lot is equivalent of 10 units
- Calculations for exchange rate used as of 11:30 (GMT) 12/23/2025
There is a possibility to use Stop-Loss and Take-Profit
- You may wish to consider closing your position in profit, even if it is lower than the suggested one.
- Trailing stop technique could protect the profit