USA30 Weekly Special Report based on 1.00 Lot Calculation:
USA30 INDEX:
- WHAT IS A STOCK INDEX: According to Investopedia.com, a stock index measures the price performance of a basket (group) of stocks using a standardized metric and methodology. The Dow Jones (USA30) is one of the world's best-known indexes and one of the most commonly used benchmarks for the stock market.
- COMPONENTS: USA30 includes 30 companies such as Amazon, Boeing, JPMorgan, Nike, Walmart, Coca-Cola and etc.
U.S. Q1 EARNINGS SEASON (April 11 – May 15):
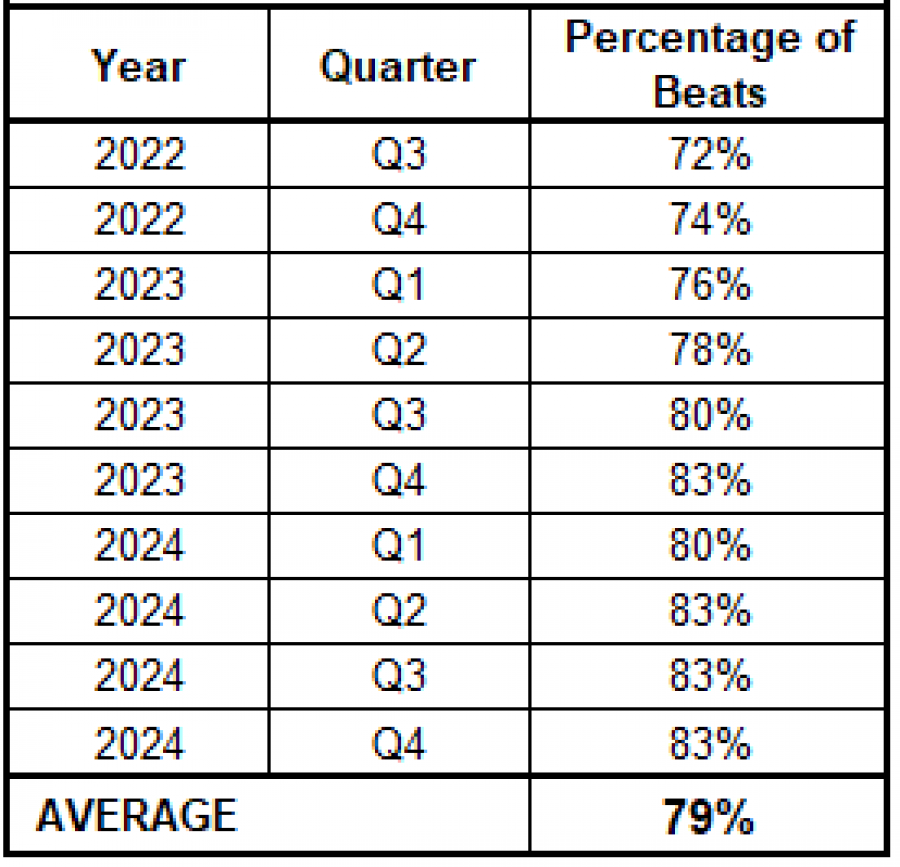
- USA30 INDEX COMPANIES DURING LAST 10 QUARTERLY EARNINGS SEASONS: 79% OF THE COMPANIES ON AVEARAGE HAS BEAT EARNINGS ESTIMATES. When a company exceeds earnings expectations, it signals stronger than anticipated performance, boosting investor confidence.
Data Source: Reuters, CNBC, Bloomberg, Google
Please note that past performance does not guarantee future results
Q1 EARNINGS CALENDAR:
- DISNEY: 07/05/2025 – PREMARKET
- WALMART: 15/05/2025 – PREMARKET
- NVIDIA: 28/05/2025 – AFTERMARKET
US FEDERAL RESERVE HAS BEGUN YET ANOTHER INTEREST RATE CUT CYCLE:
- FEDERAL RESERVE INTEREST RATE AT 4.5%. The US Federal Reserve decided to cut its benchmark interest rate by 0.50% points in September, 0.25% points in November, and 0.25% in December. The bank expects to cut rates two more times in 2025 to slash its benchmark rate to 3.9% by the end of 2025. The bank expects rates to fall to 3.40% in 2026 and further down to 3.10% in 2027.
- NEXT FED INTEREST RATE DECISION: May 7, 2025 AT 19:00 GMT+1. Markets have recently raised their expectations for three interest rate cuts in 2025, which could eventually bring rates down to 3.75% from the current 4.5% (Source: CMEGROUP.COM).
PRICE ACTION:
- USA30 INDEX HIT AN ALL-TIME HIGH OF 45,224 (JANUARY 31, 2025). The index has traded around 41,020 and if a full recovery takes place, USA30 could rise around 10%. Although, the index could decline in price as well.
USA30, May 6, 2025
Current Price: 41,020
|
USA30 |
Weekly |
|
Trend direction |
|
|
45,220 |
|
|
43,800 |
|
|
42,500 |
|
|
39,800 |
|
|
39,600 |
|
|
39,400 |
Example of calculation base on weekly trend direction for 1.00 Lot1
|
USA30 |
||||||
|
Profit or loss in $ |
42,000 |
27,800 |
14,800 |
-12,200 |
-14,200 |
-16,200 |
|
Profit or loss in €² |
37,112 |
24,565 |
13,078 |
-10,780 |
-12,547 |
-14,315 |
|
Profit or loss in £² |
31,579 |
20,902 |
11,128 |
-9,173 |
-10,677 |
-12,180 |
|
Profit or loss in C$² |
58,061 |
38,431 |
20,460 |
-16,865 |
-19,630 |
-22,395 |
- 1.00 lot is equivalent of 10 units
- Calculations for exchange rate used as of 11:00 (GMT+1) 06/05/2025
There is a possibility to use Stop-Loss and Take-Profit.
- You may wish to consider closing your position in profit, even if it is lower than suggested one.
- Trailing stop technique could protect the profit.