USA30 Weekly Special Report based on 1.00 Lot Calculation:
USA30:
- USA30 represents the Dow Jones Industrial Average, one of the oldest and most widely followed U.S. stock indexes. It tracks the performance of 30 large, established U.S. companies and is price-weighted, meaning higher-priced stocks have a greater impact on the index. The index includes major blue-chip names such as Apple, Microsoft, Nvidia, Amazon, Boeing, JPMorgan, Coca-Cola, Walmart, and Nike, making it a key benchmark for overall U.S. market performance.
EVENTS:
- WEDNESDAY, FEBRUARY 11 AT 13:30 GMT: U.S. NONFARM PAYROLLS (NFP) AND UNEMPLOYMENT RATE (JANUARY). Weaker job growth or a higher unemployment rate would strengthen expectations for Fed rate cuts, improving the outlook for growth and tech stocks and supporting further gains in the USA30.
- FRIDAY, FEBRUARY 13 AT 13:30 GMT: US INFLATION DATA (CPI) (JANUARY). A softer inflation print would reinforce expectations for Fed easing, lowering borrowing costs, and supporting equity valuations. This environment is typically supportive for blue-chip stocks and could add upside momentum to the USA30. U.S. headline CPI currently stands at 2.7%, down from recent highs near 3%.
- FRIDAY, FEBRUARY 20 AT 13:30 GMT: US GROSS DOMESTIC PRODUCT (Q4). A stronger Q4 GDP reading would confirm solid economic momentum, improving the outlook for corporate earnings and providing a supportive backdrop for further gains in the USA30.
- TUESDAY, FEBRUARY 24: US PRESIDENT DONALD TRUMP: STATE OF THE UNION ADDRESS. President Trump will address a joint session of Congress, marking a key yearly political event. Trump is likely to outline the US administration's successes so far and give a preview of plans for the rest of the year. He may address a variety of subjects, including the US economy, trade, foreign policy, energy, or taxation, which could all drive higher volatility with USA30.
Q4 2025 EARNINGS SEASON (FEBRUARY 10 - MARCH 25)
- The U.S. Q4 earnings season is underway, with several key USA30 constituents already having reported, including Apple, Microsoft, JPMorgan, and Amazon. Attention now turns to the next wave of major Dow components still to report, which could drive further index level volatility.
- MCDONALDS: 11/02/2026, Aftermarket
- WALMART: 19/02/2026, Aftermarket
- HOME DEPOT: 24/02/2026, Premarket
- SALESFORCE: 25/02/2026, Aftermarket
- NVIDIA: 25/02/2026, Aftermarket
- NIKE: 19/03/2026, Aftermarket
Data Source: Bloomberg Terminal.
TECHNICAL ANALYSIS:
- 100-DAY MOVING AVERAGE SUPPORTS THE UPTREND: USA30 continues to trade above the 100-day moving average, confirming that the broader trend remains positive. However, it could also decline.
- MID-TERM UPTREND CHANNEL HOLDS: USA30 is trading within a well-defined rising channel. Recent pullbacks have been contained near the lower boundary of the channel, suggesting dip buying interest. A sustained break below the channel would be needed to signal a meaningful trend change.
- BREAKING (February 10, 2026): USA30 HIT AN ALL-TIME HIGH OF 50,606.
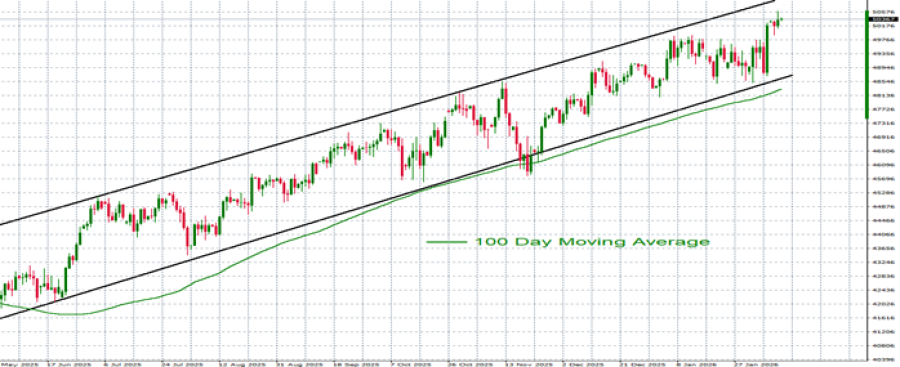
GRAPH (Daily): May 2025 – February 2026
Please note that past performance does not guarantee future results
USA30, February 11, 2026
Current Price: 50,300
|
USA30 |
Weekly |
|
Trend direction |
|
|
54,000 |
|
|
53,000 |
|
|
52,000 |
|
|
49,000 |
|
|
48,500 |
|
|
48,000 |
Example of calculation base on weekly trend direction for 1.00 Lot1
|
USA30 |
||||||
|
Pivot Points |
||||||
|
Profit or loss in $ |
37,000 |
27,000 |
17,000 |
-13,000 |
-18,000 |
-23,000 |
|
Profit or loss in €2 |
31,055 |
22,661 |
14,268 |
-10,911 |
-15,108 |
-19,304 |
|
Profit or loss in £2 |
27,037 |
19,729 |
12,422 |
-9,499 |
-13,153 |
-16,807 |
|
Profit or loss in C$2 |
50,022 |
36,502 |
22,983 |
-17,575 |
-24,335 |
-31,095 |
- 1.00 lot is equivalent of 10 units
- Calculations for exchange rate used as of 08:50 (GMT) 11/02/2025
There is a possibility to use Stop-Loss and Take-Profit.
- You may wish to consider closing your position in profit, even if it is lower than suggested one.
- Trailing stop technique could protect the profit.