USA500 Weekly Special Report based on 1.00 Lot Calculation:
USA500:
- USA500 represents the S&P 500, which includes 500 of the largest publicly traded companies in the United States across all major sectors. It features industry leaders such as Tesla, Apple, Google, Nvidia, Meta, and Goldman Sachs.
EVENTS:
- WEDNESDAY, FEBRUARY 11 AT 13:30 GMT: U.S. NONFARM PAYROLLS (NFP) AND UNEMPLOYMENT RATE (JANUARY). Weaker job growth or a higher unemployment rate would strengthen expectations for Fed rate cuts, improving the outlook for growth and tech stocks and supporting further gains in the USA500.
- FRIDAY, FEBRUARY 13 AT 13:30 GMT: US INFLATION DATA (CPI) (JANUARY). A low inflation print would reinforce expectations for Fed rate cuts, improving the outlook for equity and supporting upside momentum in the USA500. U.S. headline CPI currently stands at 2.7%, down from recent highs near 3%.
- FRIDAY, FEBRUARY 20 AT 13:30 GMT: US GROSS DOMESTIC PRODUCT (Q4). A stronger Q4 GDP reading would confirm solid economic momentum, improving the outlook for corporate earnings and providing a supportive backdrop for further gains in the USA500.
- TUESDAY, FEBRUARY 24: US PRESIDENT DONALD TRUMP: STATE OF THE UNION ADDRESS. President Trump will address a joint session of Congress marking a key yearly political event. Trump is likely to outline US administration successes so far and give a preview on plans for the rest of the year. He may address a variety of subjects including the US economy, trade, foreign policy, energy or taxation, which could all drive higher volatility with USA500.
Q4 2025 EARNINGS SEASON (FEBRUARY 6 - FEBRUARY 25)
- FEBRUARY 6 – FEBRUARY 25, 2026. The U.S. Q4 earnings season began in January, with major financial institutions already reporting. Key USA500 heavyweights such as Tesla, Meta, Apple, Intel, and AMD have now posted their Q4 2025 results. The next major companies still to report are Walmart, NVIDIA, and others.
- FORD: 2/10/2026, Aftermarket
- MCDONALDS: 2/11/2026, Aftermarket
- APPLIED MATERIALS: 2/12/2026, Aftermarket
- RIVIAN AUTOMOTIVE: 2/12/2026, Aftermarket
- COINBASE: 2/12/2026, Aftermarket
- WALMART: 2/19/2026, Aftermarket
- NVIDIA: 2/25/2026, Aftermarket
Data Source: Bloomberg Terminal;
TECHNICAL ANALYSIS:
- DAILY MOVING AVERAGES: USA500 has remained above 150-daily moving averages confirming mid-term uptrend. However, USA500 can also change its trend if prices fall below 150-daily moving average.
- UPTREND SINCE NOVEMBER 2025: USA500 has remained above the orange uptrend line since June 2025, confirming the bullish trend, though a breakout below the line remains a risk if market conditions shift.
- PRICE ACTION: USA500 HIT A FRESH ALL-TIME HIGH ON JANUARY 28, 2026 (7,042.50). USA500 currently trades around 6,840 and if a full recovery takes place, then USD500 prices could see an upside of 2.9%. The USA500 price rose 16% in 2025, extending its positive trend from 2024 (+23.20%) and 2023 (+24.65%). However, the price can also change its trend.
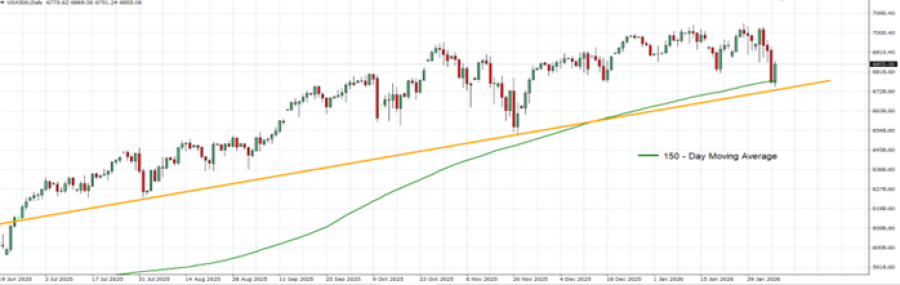
GRAPH (Daily): June 2025 – February 2026
Please note that past performance does not guarantee future results
#USA500, February 06, 2026
Current Price: 6,840
|
USA500 |
Weekly |
|
Trend direction |
|
|
7,400 |
|
|
7,200 |
|
|
7,040 |
|
|
6,650 |
|
|
6,630 |
|
|
6,600 |
Example of calculation base on weekly trend direction for 1.00 Lot1
|
USA500 |
||||||
|
Pivot Points |
||||||
|
Profit or loss in $ |
5,600 |
3,600 |
2,000 |
-1,900 |
-2,100 |
-2,400 |
|
Profit or loss in €2 |
4,750 |
3,054 |
1,697 |
-1,612 |
-1,781 |
-2,036 |
|
Profit or loss in £2 |
4,121 |
2,649 |
1,472 |
-1,398 |
-1,545 |
-1,766 |
|
Profit or loss in C$2 |
7,654 |
4,921 |
2,734 |
-2,597 |
-2,870 |
-3,280 |
- 1.00 lot is equivalent of 10 units
- Calculations for exchange rate used as of 13:00 (GMT) 06/02/2026
There is a possibility to use Stop-Loss and Take-Profit.
- You may wish to consider closing your position in profit, even if it is lower than suggested one.
- Trailing stop technique could protect the profit.