CRUDE OIL
October 5, 2026
Risk Disclaimer: The example below is for illustrative purposes only and is based on price movements derived from Contracts for Difference (CFDs). The calculations reflect hypothetical outcomes using historical or specified price data for the relevant instrument on the stated date and are not indicative of future performance. Any reliance placed on this material is strictly at the user’s own risk.
Weekly Special Report: CRUDE OIL
TECHNICAL ANALYSIS:
- RESISTANCE AREA: $95 - $100. Since the Middle East war began on February 28, 2026, crude oil has tested the $100 level or above 10 times. The price recently tested this region for the 11th time. It is worth noting that, on previous occasions, whenever crude oil tested $100 or above, it remained above this level for an average of 2.6 days, followed by a pullback below the $100 mark. However, this does not imply the same outcome will follow.
LAST TIME: Crude oil broke above $100 on September 15 and spent less than two days above the $100 mark.
- SUPPORT AREA: $85 - $80. Following previous tests of the $100 level or above, crude oil prices have subsequently pulled back toward the $87 region on average or below.
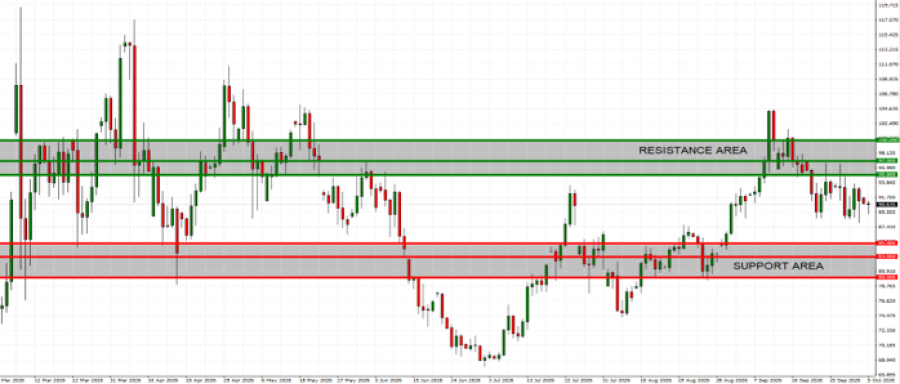
GRAPH (Daily): March 2026 – October 2026
Data Source: Meta Trader 4 Platform
Please note that past performance does not guarantee future results
Crude Oil, October 5, 2026
Current Price: 90.60
|
Crude Oil |
Weekly |
|
100 |
|
|
97 |
|
|
95 |
|
|
85 |
|
|
83 |
|
|
80 |
DOWNTREND
- G7 COUNTRIES AGREED TO RELEASE 100 MILLION BARRELS OF OIL AND DIESEL FROM EMERGENCY RESERVES. G7 countries (USA, Canada, UK, France, Germany, Italy and Japan) agreed on Friday (October 2) to release 50 million barrels of crude oil and 50 million barrels of diesel from emergency reserves.
- SAUDI ARABIA OIL EXPORTS ARE BACK ONLINE: Saudi Arabia restarted its East-West oil pipeline, restoring an important alternative route for exporting crude without passing through the Strait of Hormuz. The route is responsible for around 4% of total global supply.
- OIL EXPORTS AND SUPPLY FROM THE MIDDLE EAST HAVE REACHED ALMOST PRE-WAR LEVELS. Middle East oil exports have rebounded to around 16–19 million barrels per day, compared with roughly 20 million barrels per day before the war, according to J.P. Morgan, Goldman Sachs, and U.S. Energy Secretary Chris Wright.
- DIPLOMATIC EFFORTS: Pakistan, Qatar, and Oman are making efforts to bring the United States and Iran to the negotiation table.
- U.S. MIDTERM ELECTIONS (NOVEMBER 3, 2026): The U.S. administration is under increasing pressure as oil prices reach levels not seen in three months.
Sources: Reuters, CNBC, Bloomberg, OILPRICE.COM, Fox News
Example of calculation based on weekly market trend for 1.00 Lot1
|
CRUDE OIL |
||||||
|
Pivot Points |
||||||
|
Profit or loss in $ |
-9,400 |
-6,400 |
-4,400 |
5,600 |
7,600 |
10,600 |
|
Profit or loss in €2 |
-8,389 |
-5,712 |
-3,927 |
4,998 |
6,783 |
9,460 |
|
Profit or loss in £2 |
-7,110 |
-4,841 |
-3,328 |
4,236 |
5,749 |
8,018 |
|
Profit or loss in C$2 |
-13,391 |
-9,118 |
-6,268 |
7,978 |
10,827 |
15,101 |
- The above calculations are made based on 1.00 lot which is equivalent of 1000 units
- Calculations for exchange rate used as of 10:30 (GMT+1) 05/10/2026
You can use risk management tools such as Stop-Loss and Take-Profit
UPTREND
- YEMENI HOUTHIS–SAUDI ARABIA CONFLICT: The conflict between the Yemeni Houthis and Saudi Arabia continues to escalate, putting upward pressure on oil prices.
- STRAITS OF HORMUZ AND BAB EL-MANDEB UNCERTAINTIES: Continued uncertainty surrounding the Strait of Hormuz and the Bab el-Mandeb Strait could keep upward pressure on oil prices.
- U.S.–IRAN CONFLICT: The United States and Iran have recently exchanged strikes and attacks. They also engaged in tanker-for-tanker attacks, keeping upward pressure on oil prices.
Sources: Reuters, CNBC, Bloomberg, OILPRICE.COM, Fox News
Example of calculation based on weekly market trend for 1.00 Lot1
|
CRUDE OIL |
||||||
|
Pivot Points |
||||||
|
Profit or loss in $ |
9,400 |
6,400 |
4,400 |
-5,600 |
-7,600 |
-10,600 |
|
Profit or loss in €2 |
8,389 |
5,712 |
3,927 |
-4,998 |
-6,783 |
-9,460 |
|
Profit or loss in £2 |
7,110 |
4,841 |
3,328 |
-4,236 |
-5,749 |
-8,018 |
|
Profit or loss in C$2 |
13,391 |
9,118 |
6,268 |
-7,978 |
-10,827 |
-15,101 |
- The above calculations are made based on 1.00 lot which is equivalent of 1000 units
- Calculations for exchange rate used as of 10:30 (GMT+1) 05/10/2026
You can use risk management tools such as Stop-Loss and Take-Profit


