77% of retail investor accounts lose money when trading CFDs with this provider.
CFDs are complex instruments and come with a high risk of losing money rapidly due to leverage. 77% of retail investor accounts lose money when trading CFDs with this provider. You should consider whether you understand how CFDs work and whether you can afford to take the high risk of losing your money.
76% of retail investor accounts lose money when trading CFDs with this provider.
CFDs are complex instruments and come with a high risk of losing money rapidly due to leverage. 76% of retail investor accounts lose money when trading CFDs with this provider. You should consider whether you can afford to take the high risk of losing your money.
US Session Analysis for CFD Instruments 26/02/2021
Fundamental analysis
26 February, 2021
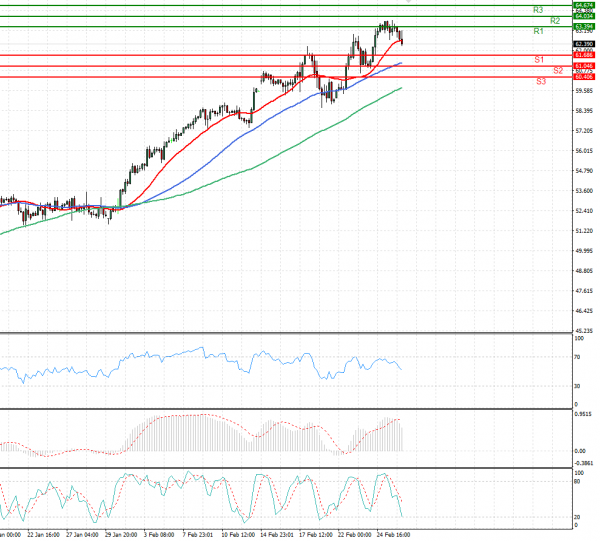
Oil prices fell on Friday as a collapse in bond prices led to gains in the U.S. dollar while crude supply is expected to rise in repsonse to prices back above pre-pandemic levels. A sell-off in bond markets lifted the U.S. dollar, making dollar-priced oil more expensive for holders of other currencies. Despite Friday’s price declines, both Brent and WTI are on track for monthly gains of about 20% on supply disruptions in the United States and optimism over demand recovery on the back of COVID-19 vaccination programmes. Investors are betting that next week’s meeting of the Organization of the Petroleum Exporting Countries (OPEC) and allies, a group known as OPEC+, will result in more supply returning to the market.