Fortrade Canada Ltd. as an order-execution only dealer is not permitted to provide you with any advice or recommendations. These Market Commentaries should not be construed as a recommendation, advice or any attempt by Fortrade Canada Ltd. to prompt or influence you in making an investment decision to purchase, sell, hold or exchange any security or to influence the timing of such activity. This content is produced by Fortrade Limited which is not registered in any capacity with any securities regulatory authority in Canada.
69% of retail investor accounts lose money when trading CFDs with this provider.
CFDs are complex instruments and come with a high risk of losing money rapidly due to leverage. 69% of retail investor accounts lose money when trading CFDs with this provider. You should consider whether you understand how CFDs work and whether you can afford to take the high risk of losing your money.
67.52% of retail investor accounts lose money when trading CFDs with this provider.
CFDs are complex instruments and come with a high risk of losing money rapidly due to leverage. 67.52% of retail investor accounts lose money when trading CFDs with this provider. You should consider whether you understand how CFDs work and whether you can afford to take the high risk of losing all your money. Read full risk warning.
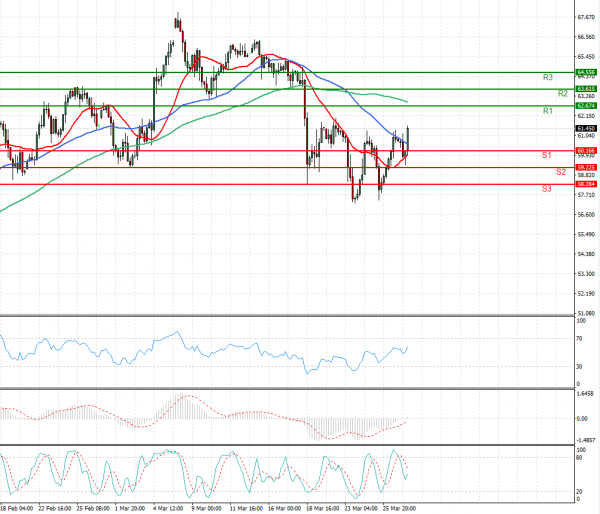
US Session Analysis for CFD Instruments 29/03/2021
Fundamental analysis
29 March, 2021
Oil fell on Monday as a container ship blocking the Suez Canal for nearly a week was partially refloated raising hopes the busy waterway would soon be reopened and as fuel demand in Europe stayed weak. Prices have swung wildly in the last few days as traders and investors tried to weigh the impact of the blockage of a key trade transit point and the broader effect of lockdowns to stop coronavirus infections. The market is getting some support from expectations that the Organization of the Petroleum Exporting Countries and its allies will maintain lower output levels when they meet this week.