Fortrade Canada Ltd. as an order-execution only dealer is not permitted to provide you with any advice or recommendations. These Market Commentaries should not be construed as a recommendation, advice or any attempt by Fortrade Canada Ltd. to prompt or influence you in making an investment decision to purchase, sell, hold or exchange any security or to influence the timing of such activity. This content is produced by Fortrade Limited which is not registered in any capacity with any securities regulatory authority in Canada.
69% of retail investor accounts lose money when trading CFDs with this provider.
CFDs are complex instruments and come with a high risk of losing money rapidly due to leverage. 69% of retail investor accounts lose money when trading CFDs with this provider. You should consider whether you understand how CFDs work and whether you can afford to take the high risk of losing your money.
67.52% of retail investor accounts lose money when trading CFDs with this provider.
CFDs are complex instruments and come with a high risk of losing money rapidly due to leverage. 67.52% of retail investor accounts lose money when trading CFDs with this provider. You should consider whether you understand how CFDs work and whether you can afford to take the high risk of losing all your money. Read full risk warning.
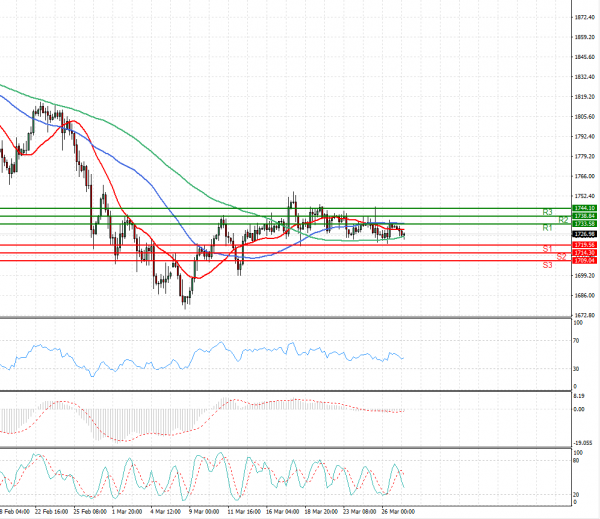
US Session Analysis for CFD Instruments 29/03/2021
Fundamental analysis
29 March, 2021
Gold prices fell on Monday as a stronger U.S. dollar and hopes for a swift global economic recovery boosted share markets, denting demand for a safe haven. The dollar index held firm near four-month highs against its rivals, making gold more expensive for holders of other currencies. Gold's safe-haven demand was also hurt as investors' appetite for riskier assets grew. European stocks edged closer to a record high on Monday on optimism over a global economic recovery. Market participants are now waiting for U.S. President Joe Biden's infrastructure spending package on Wednesday, which is speculated to be in the $3 trillion to $4 trillion range.