Fortrade Canada Ltd. as an order-execution only dealer is not permitted to provide you with any advice or recommendations. These Market Commentaries should not be construed as a recommendation, advice or any attempt by Fortrade Canada Ltd. to prompt or influence you in making an investment decision to purchase, sell, hold or exchange any security or to influence the timing of such activity. This content is produced by Fortrade Limited which is not registered in any capacity with any securities regulatory authority in Canada.
69% of retail investor accounts lose money when trading CFDs with this provider.
CFDs are complex instruments and come with a high risk of losing money rapidly due to leverage. 69% of retail investor accounts lose money when trading CFDs with this provider. You should consider whether you understand how CFDs work and whether you can afford to take the high risk of losing your money.
67.52% of retail investor accounts lose money when trading CFDs with this provider.
CFDs are complex instruments and come with a high risk of losing money rapidly due to leverage. 67.52% of retail investor accounts lose money when trading CFDs with this provider. You should consider whether you understand how CFDs work and whether you can afford to take the high risk of losing all your money. Read full risk warning.
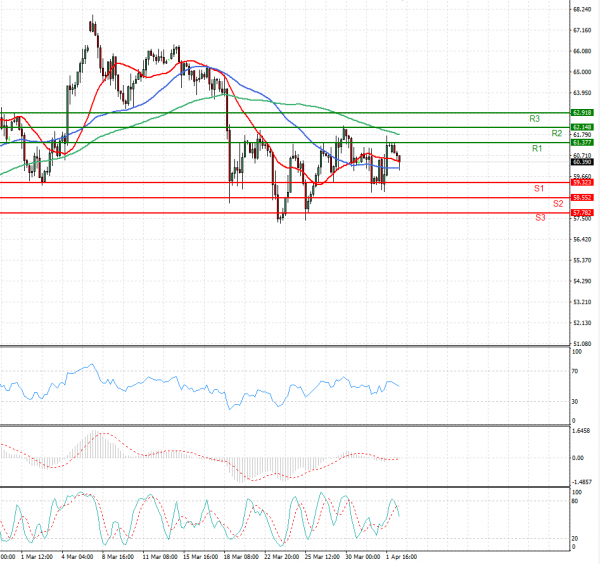
US Session Analysis for CFD Instruments 05/04/2021
Fundamental analysis
05 April, 2021
Oil slipped to around $64 a barrel on Monday as rising supply from OPEC+ and higher Iranian output countered signs of a strong economic rebound in the United States and hopes for a wider demand recovery in 2021. The Organization of the Petroleum Exporting Countries and allies, known as OPEC+, agreed on Thursday to monthly production hikes from May to July. Iran is also boosting supply. Oil has recovered from historic lows last year due to record OPEC+ cuts, most of which will still remain after July, and some oil demand recovery that is expected to gather pace in the second half of the year. While a slow vaccine rollout and return to lockdown in parts of Europe have weighed on the rebound, figures on Friday showed the U.S. economy created the most jobs in seven months in March, with all industries adding jobs. In another development that could eventually lead to more supply, investors are focused on indirect talks between Iran and the United States as part of negotiations to revive the 2015 nuclear deal between Tehran and global powers.