Fortrade Canada Ltd. as an order-execution only dealer is not permitted to provide you with any advice or recommendations. These Market Commentaries should not be construed as a recommendation, advice or any attempt by Fortrade Canada Ltd. to prompt or influence you in making an investment decision to purchase, sell, hold or exchange any security or to influence the timing of such activity. This content is produced by Fortrade Limited which is not registered in any capacity with any securities regulatory authority in Canada.
69% of retail investor accounts lose money when trading CFDs with this provider.
CFDs are complex instruments and come with a high risk of losing money rapidly due to leverage. 69% of retail investor accounts lose money when trading CFDs with this provider. You should consider whether you understand how CFDs work and whether you can afford to take the high risk of losing your money.
67.52% of retail investor accounts lose money when trading CFDs with this provider.
CFDs are complex instruments and come with a high risk of losing money rapidly due to leverage. 67.52% of retail investor accounts lose money when trading CFDs with this provider. You should consider whether you understand how CFDs work and whether you can afford to take the high risk of losing all your money. Read full risk warning.
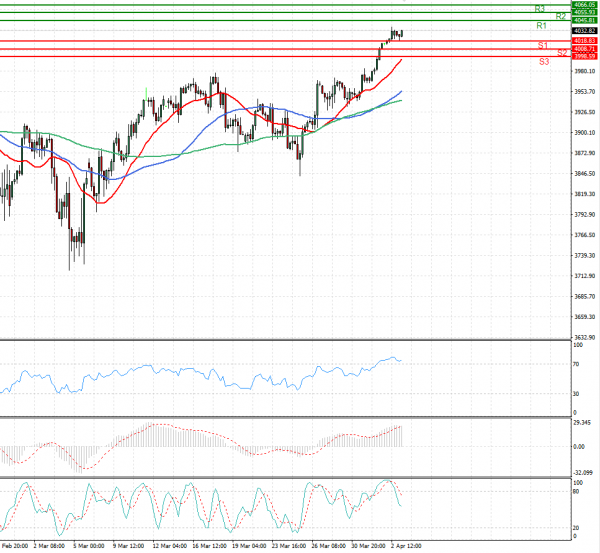
US Session Analysis for CFD Instruments 05/04/2021
Fundamental analysis
05 April, 2021
U.S. stock futures rose Monday following a strong jobs report and ahead of fresh data that is expected to show recovery in the U.S. services sector. Futures tied to the S&P 500 gained 0.5%, indicating that the broad market gauge could rise after the New York opening bell. Dow Jones Industrial Average futures climbed 0.6% and Nasdaq-100 futures added 0.4%. Stock markets Monday will have their first chance to react to Friday’s jobs report, which showed that U.S. hiring surged in March as the economic recovery accelerated. Employers added a seasonally adjusted 916,000 jobs in March, the best gain since August. The fast pace of hiring is likely to bolster hopes for a stronger economic rebound and continue driving investors to stocks hardest hit by the pandemic.