Fortrade Canada Ltd. as an order-execution only dealer is not permitted to provide you with any advice or recommendations. These Market Commentaries should not be construed as a recommendation, advice or any attempt by Fortrade Canada Ltd. to prompt or influence you in making an investment decision to purchase, sell, hold or exchange any security or to influence the timing of such activity. This content is produced by Fortrade Limited which is not registered in any capacity with any securities regulatory authority in Canada.
70% of retail investor accounts lose money when trading CFDs with this provider.
CFDs are complex instruments and come with a high risk of losing money rapidly due to leverage. 70% of retail investor accounts lose money when trading CFDs with this provider. You should consider whether you understand how CFDs work and whether you can afford to take the high risk of losing your money.
70.41% of retail investor accounts lose money when trading CFDs with this provider.
CFDs are complex instruments and come with a high risk of losing money rapidly due to leverage. 70.41% of retail investor accounts lose money when trading CFDs with this provider. You should consider whether you understand how CFDs work and whether you can afford to take the high risk of losing all your money. Read full risk warning.
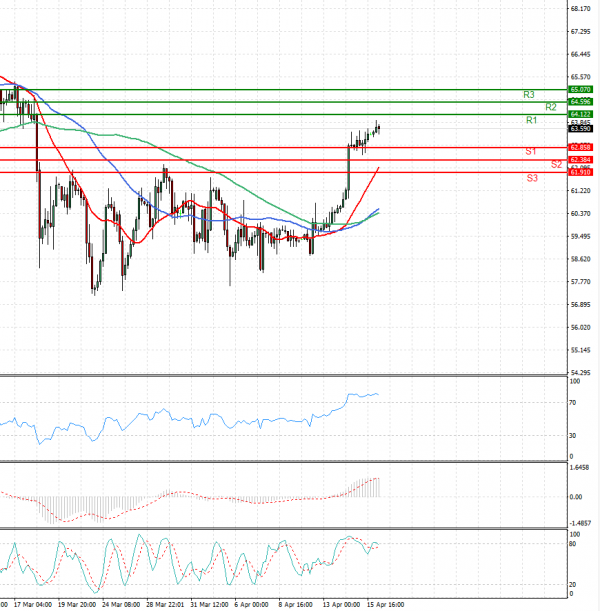
US Session Analysis for CFD Instruments 16/04/2021
Fundamental analysis
16 April, 2021
Oil rose above $67 a barrel on Friday, gaining for a fifth session, as a stronger demand outlook and signs of economic recovery in China and the United States offset rising COVID-19 infections in some other major economies. Demand hopes offset concern about rising coronavirus cases in other big economies. India’s infection rate hit a record while Germany’s chancellor on Friday said a third virus wave has the country in its grip. Oil has recovered from record lows hit last year as demand collapsed due to the pandemic. It has been helped by record cuts to oil output by OPEC+ producers. OPEC+ agreed on April 1 to ease its oil output cuts from May to July and will meet to consider further tweaks on April 28.