Fortrade Canada Ltd. as an order-execution only dealer is not permitted to provide you with any advice or recommendations. These Market Commentaries should not be construed as a recommendation, advice or any attempt by Fortrade Canada Ltd. to prompt or influence you in making an investment decision to purchase, sell, hold or exchange any security or to influence the timing of such activity. This content is produced by Fortrade Limited which is not registered in any capacity with any securities regulatory authority in Canada.
70% of retail investor accounts lose money when trading CFDs with this provider.
CFDs are complex instruments and come with a high risk of losing money rapidly due to leverage. 70% of retail investor accounts lose money when trading CFDs with this provider. You should consider whether you understand how CFDs work and whether you can afford to take the high risk of losing your money.
70.41% of retail investor accounts lose money when trading CFDs with this provider.
CFDs are complex instruments and come with a high risk of losing money rapidly due to leverage. 70.41% of retail investor accounts lose money when trading CFDs with this provider. You should consider whether you understand how CFDs work and whether you can afford to take the high risk of losing all your money. Read full risk warning.
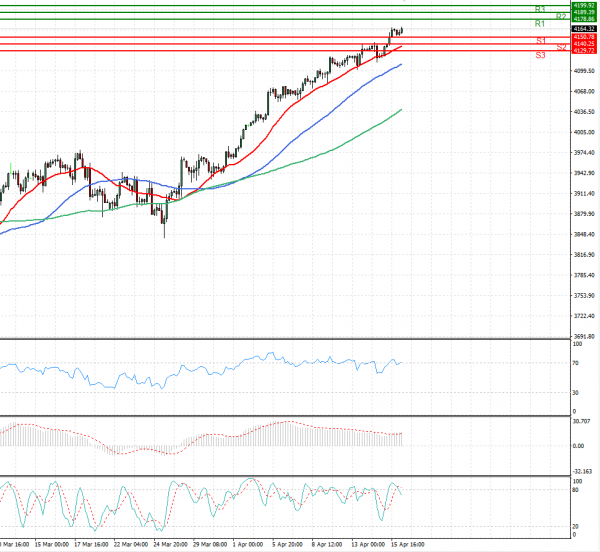
US Session Analysis for CFD Instruments 16/04/2021
Fundamental analysis
16 April, 2021
U.S. stock index futures were subdued on Friday after the S&P 500 and the Dow closed at record highs in the previous session, while investors geared up for Morgan Stanley to wrap up quarterly earnings reports from the big U.S. banks. Wall Street's main indexes have bounced this month as solid economic data as well as the Federal Reserve's pledge to keep interest rates low despite higher inflation boosted demand, particularly for richly valued technology stocks. The benchmark S&P 500 and the blue-chip Dow are on course for their fourth straight week of gains, while the technology-heavy Nasdaq is less than a percent below its own all-time peak. Tech behemoths Apple Inc, Amazon.com Inc, Tesla Inc Microsoft Corp, which led Wall Street's recovery last year from the coronavirus-fueled crash, edged down in premarket trading after leading gains in the previous session.