CFDs are complex instruments and come with a high risk of losing money rapidly due to leverage. 66% of retail investor accounts lose money when trading CFDs with this provider. You should consider whether you understand how CFDs work and whether you can afford to take the high risk of losing your money.
CFDs are complex instruments and come with a high risk of losing money rapidly due to leverage. 70.91% of retail investor accounts lose money when trading CFDs with this provider. You should consider whether you understand how CFDs work and whether you can afford to take the high risk of losing all your money. Read full risk warning.

Crude Oil Analysis

US Session Analysis for CFD Instruments 21/04/2021

Fundamental analysis

21 April, 2021

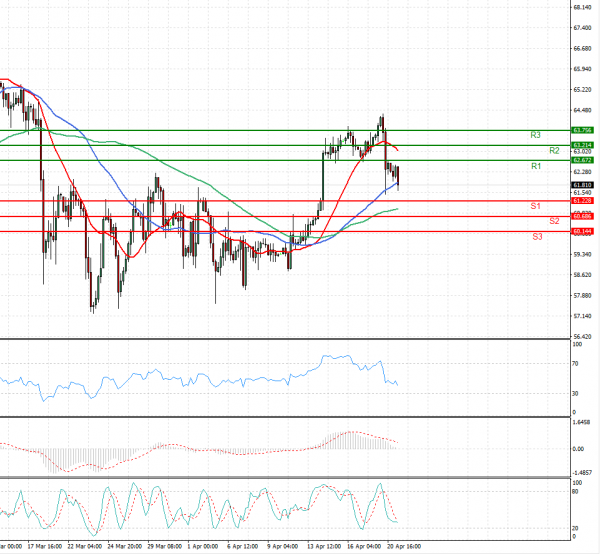
Oil prices fell for a second day on Wednesday, weighed down by concerns that surging COVID-19 cases in India will drive down fuel demand in the world’s third-biggest oil importer. India, also the world’s third-largest oil user, on Wednesday reported another record increase in the daily death toll from COVID-19, at 2,023, and another record rise in cases at more than 295,000. The country, where large parts are now under lockdown due to a huge second wave of the pandemic, is facing an oxygen supply crisis to treat patients. Further battering the market, data from the American Petroleum Institute (API) industry group showed U.S. crude oil and distillate stocks rose in the week ended April 16, according to two market sources, compared with analysts’ forecasts for drawdown in inventories. Crude stocks rose by 436,000 barrels, API reported, according to the sources. Analysts polled by Reuters had expected a 3 million barrel drawdown in crude stocks.

Technical analysis

Crude Oil Analysis Technical analysis 21/04/2021
Time Frame: 1 hour

CRUDEOIL Support & Resistance Table - 21/04/2021

Support & Resistance Level Explanation
Resistance 2 63.214 Daily R2
Resistance 1 62.672 Daily R1
Support 1 61.228 Daily S1
Support 2 60.686 Daily S2

CRUDEOIL Indicator Table - 21/04/2021

Indicator Signal
SMA 20 Sell
SMA 50 Buy
SMA 100 Buy
MACD( 12;26;9) Buy
RSI (14) Sell
Stochastic ( 9;6;3) Sell

CRUDEOIL Indicator / Period Table - 21/04/2021

Indicator / Period Day - SellWeek - BuyMonth - Buy
MACD( 12;26;9) Buy BuyNeutral
RSI (14) Sell BuyBuy
SMA 20 Sell BuyBuy

CRUDEOIL 21/04/2021 - Reference Price : 61.950

Sell
Simple Moving AverageBuy (2)Sell (1)
Technical Indicators - OscillatorsBuy (1)Sell (2)
Share It With Your Network
Crude OIL Chart
Update Time: -
Highest
Lowest
1M 5M H D W
Prices are loading..
Ready for trading?Start Now