Fortrade Canada Ltd. as an order-execution only dealer is not permitted to provide you with any advice or recommendations. These Market Commentaries should not be construed as a recommendation, advice or any attempt by Fortrade Canada Ltd. to prompt or influence you in making an investment decision to purchase, sell, hold or exchange any security or to influence the timing of such activity. This content is produced by Fortrade Limited which is not registered in any capacity with any securities regulatory authority in Canada.
71% of retail investor accounts lose money when trading CFDs with this provider.
CFDs are complex instruments and come with a high risk of losing money rapidly due to leverage. 71% of retail investor accounts lose money when trading CFDs with this provider. You should consider whether you understand how CFDs work and whether you can afford to take the high risk of losing your money.
70.41% of retail investor accounts lose money when trading CFDs with this provider.
CFDs are complex instruments and come with a high risk of losing money rapidly due to leverage. 70.41% of retail investor accounts lose money when trading CFDs with this provider. You should consider whether you understand how CFDs work and whether you can afford to take the high risk of losing all your money. Read full risk warning.
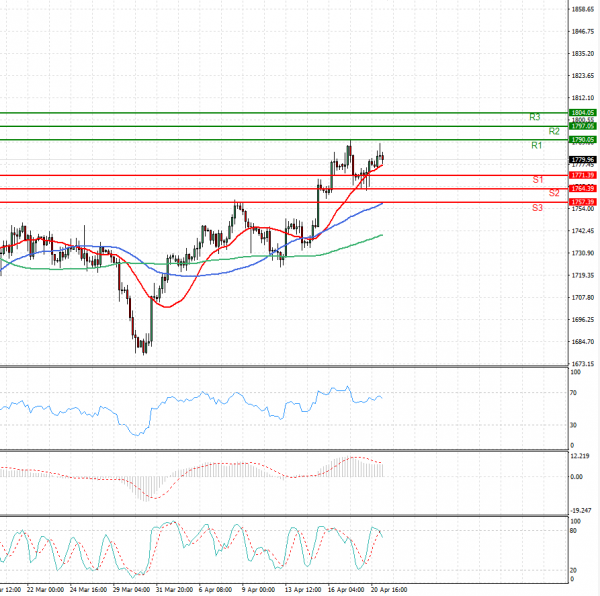
US Session Analysis for CFD Instruments 21/04/2021
Fundamental analysis
21 April, 2021
Gold prices rose on Wednesday, hovering near a seven-week high hit earlier this week, as a softer dollar and a retreat in U.S. Treasury yields lifted demand for the safe-haven metal. The dollar index was languishing near a seven-week low against its rivals, while benchmark 10-year U.S. Treasury yields dropped below 1.6%, reducing the opportunity cost of holding non-yielding bullion. Market participants now await the European Central Bank meeting on Thursday for further clarity about stimulus plans for the bloc. The U.S. Federal Reserve policy meeting is due next week. Gold is seen as a hedge against inflation that could follow stimulus measures, but higher Treasury yields have dulled some of the appeal of the non-yielding commodity this year.