Fortrade Canada Ltd. as an order-execution only dealer is not permitted to provide you with any advice or recommendations. These Market Commentaries should not be construed as a recommendation, advice or any attempt by Fortrade Canada Ltd. to prompt or influence you in making an investment decision to purchase, sell, hold or exchange any security or to influence the timing of such activity. This content is produced by Fortrade Limited which is not registered in any capacity with any securities regulatory authority in Canada.
70% of retail investor accounts lose money when trading CFDs with this provider.
CFDs are complex instruments and come with a high risk of losing money rapidly due to leverage. 70% of retail investor accounts lose money when trading CFDs with this provider. You should consider whether you understand how CFDs work and whether you can afford to take the high risk of losing your money.
70.41% of retail investor accounts lose money when trading CFDs with this provider.
CFDs are complex instruments and come with a high risk of losing money rapidly due to leverage. 70.41% of retail investor accounts lose money when trading CFDs with this provider. You should consider whether you understand how CFDs work and whether you can afford to take the high risk of losing all your money. Read full risk warning.
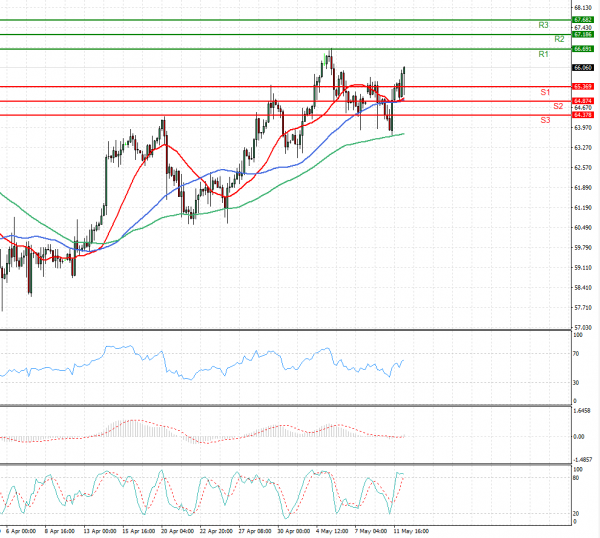
US Session Analysis for CFD Instruments 12/05/2021
Fundamental analysis
12 May, 2021
Oil prices rose on Wednesday on signs of a speedy economic recovery and upbeat predictions for energy demand in light of progress with vaccinations against COVID-19, though waves of infections in India and Brazil weighed on gains. The International Energy Agency (IEA) said in its monthly report that demand for oil will exceed the output of the top producers. Oil prices were also supported by the outlook from the Organization of the Petroleum Exporting Countries (OPEC), which on Tuesday stuck to a forecast for a strong recovery in world oil demand in 2021, with growth in China and the United States outweighing the impact of the coronavirus crisis in India.