CFDs are complex instruments and come with a high risk of losing money rapidly due to leverage. 66% of retail investor accounts lose money when trading CFDs with this provider. You should consider whether you understand how CFDs work and whether you can afford to take the high risk of losing your money.
CFDs are complex instruments and come with a high risk of losing money rapidly due to leverage. 70.91% of retail investor accounts lose money when trading CFDs with this provider. You should consider whether you understand how CFDs work and whether you can afford to take the high risk of losing all your money. Read full risk warning.

Crude Oil Analysis

US Session Analysis for CFD Instruments 21/10/2021

Fundamental analysis

21 October, 2021

Oil prices fell on Thursday as some investors scooped up profits from the recent rally, though solid demand in the United States and a switch to fuel oil from coal and gas amid surging prices capped losses. Crude prices have risen as supply has tightened, with the Organization of the Petroleum Exporting Countries maintaining a slow increase in supply rather than intervening to add more barrels to the market. Oil markets hit multi-year highs earlier in the week also supported by a global coal and gas crunch, which has driven a switch to diesel and fuel oil for power generation. Strong demand in the United States was confirmed by the latest weekly data. U.S. crude stocks fell by 431,000 barrels in the week to Oct. 15 to 426.5 million barrels, compared with analysts’ expectations in a Reuters poll for a 1.9 million-barrel rise, the U.S. Energy Information Administration (EIA) said on Wednesday. U.S. gasoline stocks fell by a more-than-expected 5.4 million barrels to 217.7 million barrels, the lowest since November 2019, the EIA said.
Technical analysis

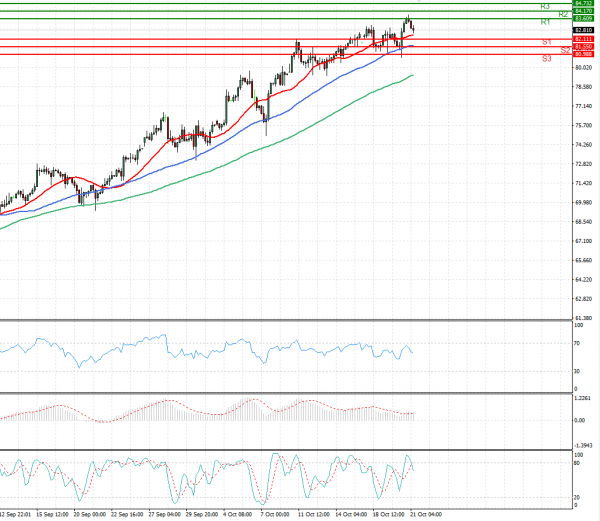
Crude Oil Analysis Technical analysis 21/10/2021
Time Frame: 1 hour

CRUDEOIL Support & Resistance Table - 21/10/2021

Support & Resistance Level Explanation
Resistance 2 84.170 Daily R2
Resistance 1 83.609 Daily R1
Support 1 82.111 Daily S1
Support 2 81.550 Daily S2

CRUDEOIL Indicator Table - 21/10/2021

Indicator Signal
SMA 20 Buy
SMA 50 Buy
SMA 100 Buy
MACD( 12;26;9) Buy
RSI (14) Buy
Stochastic ( 9;6;3) Buy

CRUDEOIL Indicator / Period Table - 21/10/2021

Indicator / Period Day - BuyWeek - BuyMonth - Buy
MACD( 12;26;9) Buy BuyBuy
RSI (14) Buy BuyBuy
SMA 20 Buy BuyBuy

CRUDEOIL 21/10/2021 - Reference Price : 82.860

Buy
Simple Moving AverageBuy (3)Sell (0)
Technical Indicators - OscillatorsBuy (3)Sell (0)
Share It With Your Network
Crude OIL Chart
Update Time: -
Highest
Lowest
1M 5M H D W
Prices are loading..
Ready for trading?Start Now