Fortrade Canada Ltd. as an order-execution only dealer is not permitted to provide you with any advice or recommendations. These Market Commentaries should not be construed as a recommendation, advice or any attempt by Fortrade Canada Ltd. to prompt or influence you in making an investment decision to purchase, sell, hold or exchange any security or to influence the timing of such activity. This content is produced by Fortrade Limited which is not registered in any capacity with any securities regulatory authority in Canada.
70% of retail investor accounts lose money when trading CFDs with this provider.
CFDs are complex instruments and come with a high risk of losing money rapidly due to leverage. 70% of retail investor accounts lose money when trading CFDs with this provider. You should consider whether you understand how CFDs work and whether you can afford to take the high risk of losing your money.
70.41% of retail investor accounts lose money when trading CFDs with this provider.
CFDs are complex instruments and come with a high risk of losing money rapidly due to leverage. 70.41% of retail investor accounts lose money when trading CFDs with this provider. You should consider whether you understand how CFDs work and whether you can afford to take the high risk of losing all your money. Read full risk warning.
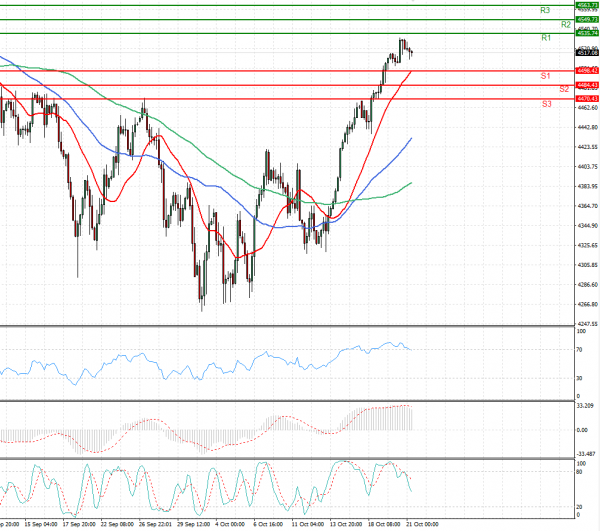
US Session Analysis for CFD Instruments 21/10/2021
Fundamental analysis
21 October, 2021
U.S. stock indexes were poised for muted opening losses as investors awaited another batch of earnings reports and data on the labor market. Futures for the S&P 500 slipped 0.3% Thursday, a day after the broad stocks gauge climbed for a sixth consecutive session and closed at its second-highest level on record. Contracts for the Dow Jones Industrial Average—which also stands just shy of its mid-August record—ticked down 0.3%. Futures for the Nasdaq-100 also fell 0.3%, pointing to some pressure on technology stocks at the opening bell.