Fortrade Canada Ltd. as an order-execution only dealer is not permitted to provide you with any advice or recommendations. These Market Commentaries should not be construed as a recommendation, advice or any attempt by Fortrade Canada Ltd. to prompt or influence you in making an investment decision to purchase, sell, hold or exchange any security or to influence the timing of such activity. This content is produced by Fortrade Limited which is not registered in any capacity with any securities regulatory authority in Canada.
66% of retail investor accounts lose money when trading CFDs with this provider.
CFDs are complex instruments and come with a high risk of losing money rapidly due to leverage. 66% of retail investor accounts lose money when trading CFDs with this provider. You should consider whether you understand how CFDs work and whether you can afford to take the high risk of losing your money.
70.91% of retail investor accounts lose money when trading CFDs with this provider.
CFDs are complex instruments and come with a high risk of losing money rapidly due to leverage. 70.91% of retail investor accounts lose money when trading CFDs with this provider. You should consider whether you understand how CFDs work and whether you can afford to take the high risk of losing all your money. Read full risk warning.
US Session Analysis for CFD Instruments 06/11/2023
Fundamental analysis
06 November, 2023
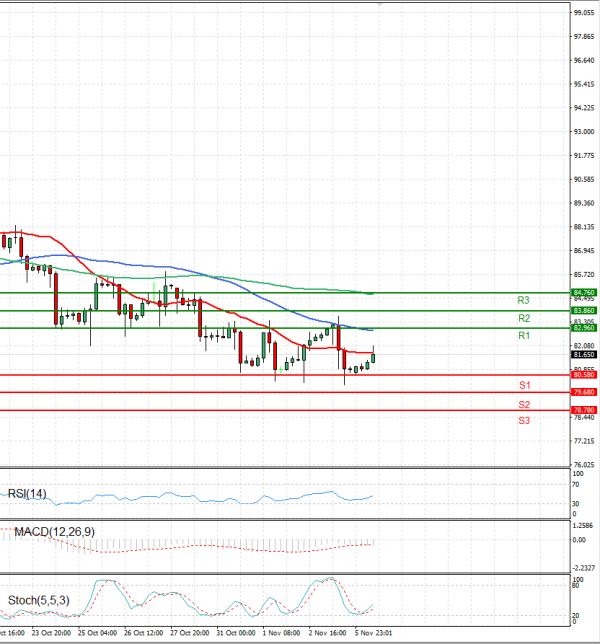
Crude oil is trading at around 82.04.
Oil prices rose on Monday, after top exporters Saudi Arabia and Russia reaffirmed their commitment to extra voluntary oil supply cuts until the end of the year.
Saudi Arabia confirmed on Sunday it would continue with its additional voluntary cut of 1 million barrels per day (bpd) in December to keep output at around 9 million bpd, a source at the ministry of energy said in a statement.
Russia also announced it would continue its additional voluntary supply cut of 300,000 bpd from its crude oil and petroleum product exports until the end of December.