Fortrade Canada Ltd. as an order-execution only dealer is not permitted to provide you with any advice or recommendations. These Market Commentaries should not be construed as a recommendation, advice or any attempt by Fortrade Canada Ltd. to prompt or influence you in making an investment decision to purchase, sell, hold or exchange any security or to influence the timing of such activity. This content is produced by Fortrade Limited which is not registered in any capacity with any securities regulatory authority in Canada.
66% of retail investor accounts lose money when trading CFDs with this provider.
CFDs are complex instruments and come with a high risk of losing money rapidly due to leverage. 66% of retail investor accounts lose money when trading CFDs with this provider. You should consider whether you understand how CFDs work and whether you can afford to take the high risk of losing your money.
70.91% of retail investor accounts lose money when trading CFDs with this provider.
CFDs are complex instruments and come with a high risk of losing money rapidly due to leverage. 70.91% of retail investor accounts lose money when trading CFDs with this provider. You should consider whether you understand how CFDs work and whether you can afford to take the high risk of losing all your money. Read full risk warning.
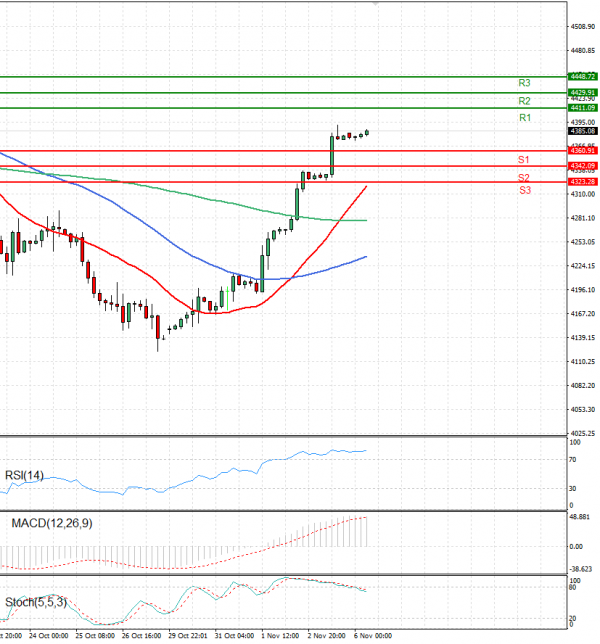
US Session Analysis for CFD Instruments 06/11/2023
Fundamental analysis
06 November, 2023
The USA500 is trading at 4,367.
U.S. stock futures nudged higher early Monday, as hopes the Federal Reserve has finished raising borrowing costs continued to underpin sentiment.
Futures indicate stocks will look on Monday to extend their latest rally, though additional gains will be meagre.
The S&P 500 rose 5.85% last week, the best weekly gain in nearly a year, after comments from Federal Reserve Chairman Jay Powell and signs of a cooling labour market forced bond yields sharply lower as expectations grew that the U.S. central bank was finished raising interest rates in this cycle.
The benchmark 10-year U.S. Treasury yield which just a few weeks ago had traded at a fresh 16-year high above 5%, at one point on Friday dipped below 4.5%.