Fortrade Canada Ltd. as an order-execution only dealer is not permitted to provide you with any advice or recommendations. These Market Commentaries should not be construed as a recommendation, advice or any attempt by Fortrade Canada Ltd. to prompt or influence you in making an investment decision to purchase, sell, hold or exchange any security or to influence the timing of such activity. This content is produced by Fortrade Limited which is not registered in any capacity with any securities regulatory authority in Canada.
70% of retail investor accounts lose money when trading CFDs with this provider.
CFDs are complex instruments and come with a high risk of losing money rapidly due to leverage. 70% of retail investor accounts lose money when trading CFDs with this provider. You should consider whether you understand how CFDs work and whether you can afford to take the high risk of losing your money.
70.41% of retail investor accounts lose money when trading CFDs with this provider.
CFDs are complex instruments and come with a high risk of losing money rapidly due to leverage. 70.41% of retail investor accounts lose money when trading CFDs with this provider. You should consider whether you understand how CFDs work and whether you can afford to take the high risk of losing all your money. Read full risk warning.
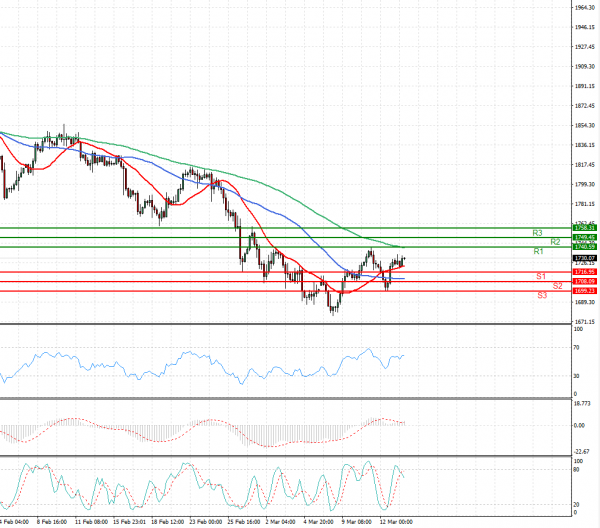
US Session Analysis for CFD Instruments 15/03/2021
Fundamental analysis
15 March, 2021
Gold edged higher on Monday on prospects of higher inflation following the approval of a $1.9 trillion U.S. stimulus bill, although elevated U.S. Treasury yields capped bullion's gains ahead of a Federal Reserve Meeting. President Joe Biden signed the $1.9 trillion stimulus bill into law last week. Some investors view gold as a hedge against higher inflation that could follow stimulus measures, but higher Treasury yields dull some of the appeal of the non-yielding commodity. Benchmark U.S. Treasury yields were at their highest in more than a year, while the dollar rose for a second straight session. Investors are now awaiting a two-day U.S. Federal Reserve meeting this week for policymakers' remarks on a recent spike in bond yields, fears about rising inflation and the economic outlook.