Fortrade Canada Ltd. as an order-execution only dealer is not permitted to provide you with any advice or recommendations. These Market Commentaries should not be construed as a recommendation, advice or any attempt by Fortrade Canada Ltd. to prompt or influence you in making an investment decision to purchase, sell, hold or exchange any security or to influence the timing of such activity. This content is produced by Fortrade Limited which is not registered in any capacity with any securities regulatory authority in Canada.
70% of retail investor accounts lose money when trading CFDs with this provider.
CFDs are complex instruments and come with a high risk of losing money rapidly due to leverage. 70% of retail investor accounts lose money when trading CFDs with this provider. You should consider whether you understand how CFDs work and whether you can afford to take the high risk of losing your money.
70.41% of retail investor accounts lose money when trading CFDs with this provider.
CFDs are complex instruments and come with a high risk of losing money rapidly due to leverage. 70.41% of retail investor accounts lose money when trading CFDs with this provider. You should consider whether you understand how CFDs work and whether you can afford to take the high risk of losing all your money. Read full risk warning.
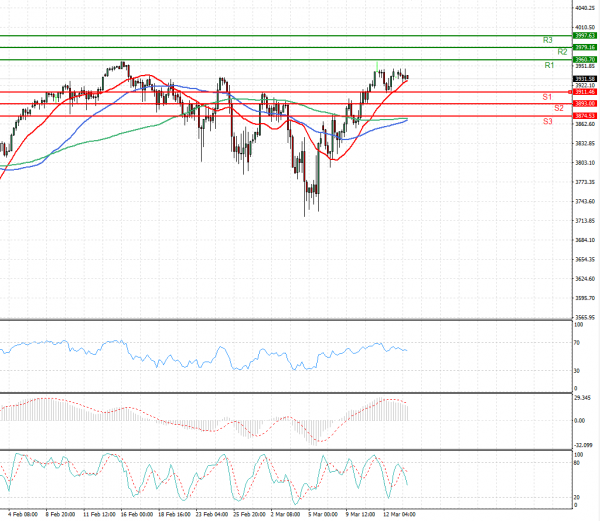
US Session Analysis for CFD Instruments 15/03/2021
Fundamental analysis
15 March, 2021
U.S. stock futures edged higher Monday, suggesting that the major indexes will extend their rally after both the Dow Jones Industrial Average and the S&P 500 closed last week at a record. Dow futures rose 0.4%, suggesting that blue-chip stocks in companies sensitive to the economic recovery will extend their gains. Contracts tied to the S&P 500 edged up 0.3%. Nasdaq-100 futures ticked 0.3% higher, pointing to muted gains for the technology sector. The stock market last week resumed its rally on a firmer footing after weeks of being buffeted by sharp moves in the U.S. government bond market. The yield on 10-year Treasurys has climbed for six straight weeks, its longest winning streak since December 2016. Some money managers have grown concerned that inflation will climb sharply, which could prompt the central bank to consider increasing interest rates within the next two years.