Fortrade Canada Ltd. as an order-execution only dealer is not permitted to provide you with any advice or recommendations. These Market Commentaries should not be construed as a recommendation, advice or any attempt by Fortrade Canada Ltd. to prompt or influence you in making an investment decision to purchase, sell, hold or exchange any security or to influence the timing of such activity. This content is produced by Fortrade Limited which is not registered in any capacity with any securities regulatory authority in Canada.
71% of retail investor accounts lose money when trading CFDs with this provider.
CFDs are complex instruments and come with a high risk of losing money rapidly due to leverage. 71% of retail investor accounts lose money when trading CFDs with this provider. You should consider whether you understand how CFDs work and whether you can afford to take the high risk of losing your money.
70.41% of retail investor accounts lose money when trading CFDs with this provider.
CFDs are complex instruments and come with a high risk of losing money rapidly due to leverage. 70.41% of retail investor accounts lose money when trading CFDs with this provider. You should consider whether you understand how CFDs work and whether you can afford to take the high risk of losing all your money. Read full risk warning.
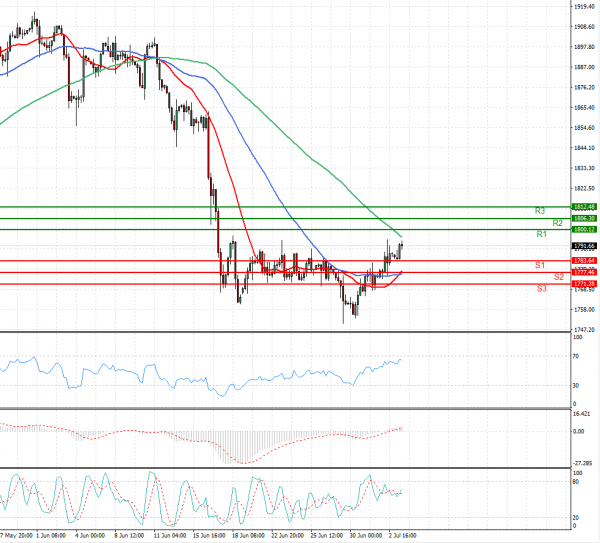
US Session Analysis for CFD Instruments 05/07/2021
Fundamental analysis
05 July, 2021
Gold prices inched higher on Monday as a softer dollar and lower bond yields amid a mixed bag of U.S. labour data allayed investor concerns about a faster policy tightening, helping the metal rise towards the $1,800 level once again. Data on Friday showed U.S. companies in June hired the most workers in 10 months, but unemployment ticked higher, workforce participation didn’t budge and the pace of hourly earnings growth slowed. Also on the radar, minutes of the Fed’s latest meeting due to be published on Wednesday could shed more light on policymakers’ views on inflation and monetary policy.