Fortrade Canada Ltd. as an order-execution only dealer is not permitted to provide you with any advice or recommendations. These Market Commentaries should not be construed as a recommendation, advice or any attempt by Fortrade Canada Ltd. to prompt or influence you in making an investment decision to purchase, sell, hold or exchange any security or to influence the timing of such activity. This content is produced by Fortrade Limited which is not registered in any capacity with any securities regulatory authority in Canada.
71% of retail investor accounts lose money when trading CFDs with this provider.
CFDs are complex instruments and come with a high risk of losing money rapidly due to leverage. 71% of retail investor accounts lose money when trading CFDs with this provider. You should consider whether you understand how CFDs work and whether you can afford to take the high risk of losing your money.
70.41% of retail investor accounts lose money when trading CFDs with this provider.
CFDs are complex instruments and come with a high risk of losing money rapidly due to leverage. 70.41% of retail investor accounts lose money when trading CFDs with this provider. You should consider whether you understand how CFDs work and whether you can afford to take the high risk of losing all your money. Read full risk warning.
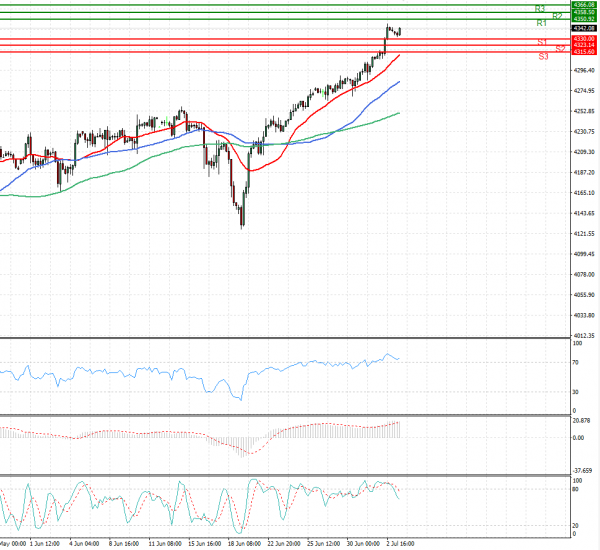
US Session Analysis for CFD Instruments 05/07/2021
Fundamental analysis
05 July, 2021
Global stocks were mixed Monday, with U.S. markets closed for the July 4 holiday and futures pointing to a tepid drop at the opening on Tuesday. The pan-continental Stoxx Europe 600 was relatively flat, while the U.K.’s FTSE 100 index inched up 0.2%. In Asia, major indexes closed on a mixed note. S&P 500 futures ticked down 0.1%, while Nasdaq-100 futures slid almost 0.2%. Major U.S. stock indexes notched record closing highs Friday after a monthly employment report confirmed that the U.S. economy continued to recover at a healthy clip. Investors say stock markets globally could be more choppy in the coming weeks as fresh data offer indications about the pace of economic recovery. Money managers are also awaiting signals from policy makers world-wide on whether they will weigh tightening easy-money policies that have aided the global recovery.