Fortrade Canada Ltd. as an order-execution only dealer is not permitted to provide you with any advice or recommendations. These Market Commentaries should not be construed as a recommendation, advice or any attempt by Fortrade Canada Ltd. to prompt or influence you in making an investment decision to purchase, sell, hold or exchange any security or to influence the timing of such activity. This content is produced by Fortrade Limited which is not registered in any capacity with any securities regulatory authority in Canada.
71% of retail investor accounts lose money when trading CFDs with this provider.
CFDs are complex instruments and come with a high risk of losing money rapidly due to leverage. 71% of retail investor accounts lose money when trading CFDs with this provider. You should consider whether you understand how CFDs work and whether you can afford to take the high risk of losing your money.
70.91% of retail investor accounts lose money when trading CFDs with this provider.
CFDs are complex instruments and come with a high risk of losing money rapidly due to leverage. 70.91% of retail investor accounts lose money when trading CFDs with this provider. You should consider whether you understand how CFDs work and whether you can afford to take the high risk of losing all your money. Read full risk warning.
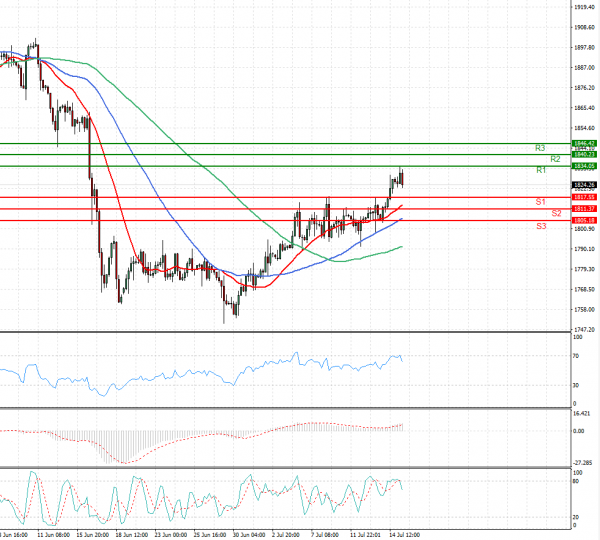
US Session Analysis for CFD Instruments 15/07/2021
Fundamental analysis
15 July, 2021
Gold prices climbed to a one-month peak on Thursday after U.S. Federal Reserve Chair Jeremy Powell soothed investor fears by reassuring that he was in no rush to tighten policy, lifting the metal’s appeal as an inflation hedge. Powell stuck to the view on Wednesday that the current price increases are transitory and the Fed expects to continue its bond-buying until there is “substantial further progress” on jobs, with interest rates pinned near zero likely until at least 2023. His comments came on the heels of a robust U.S. producer prices data. Large stimulus measures tend to support gold, which is often considered a hedge against inflation and currency debasement. Powell’s comments muted the dollar, while benchmark 10-year U.S. Treasuries yields fell, reducing the opportunity cost of holding bullion, which pays no return.