Fortrade Canada Ltd. as an order-execution only dealer is not permitted to provide you with any advice or recommendations. These Market Commentaries should not be construed as a recommendation, advice or any attempt by Fortrade Canada Ltd. to prompt or influence you in making an investment decision to purchase, sell, hold or exchange any security or to influence the timing of such activity. This content is produced by Fortrade Limited which is not registered in any capacity with any securities regulatory authority in Canada.
71% of retail investor accounts lose money when trading CFDs with this provider.
CFDs are complex instruments and come with a high risk of losing money rapidly due to leverage. 71% of retail investor accounts lose money when trading CFDs with this provider. You should consider whether you understand how CFDs work and whether you can afford to take the high risk of losing your money.
70.91% of retail investor accounts lose money when trading CFDs with this provider.
CFDs are complex instruments and come with a high risk of losing money rapidly due to leverage. 70.91% of retail investor accounts lose money when trading CFDs with this provider. You should consider whether you understand how CFDs work and whether you can afford to take the high risk of losing all your money. Read full risk warning.
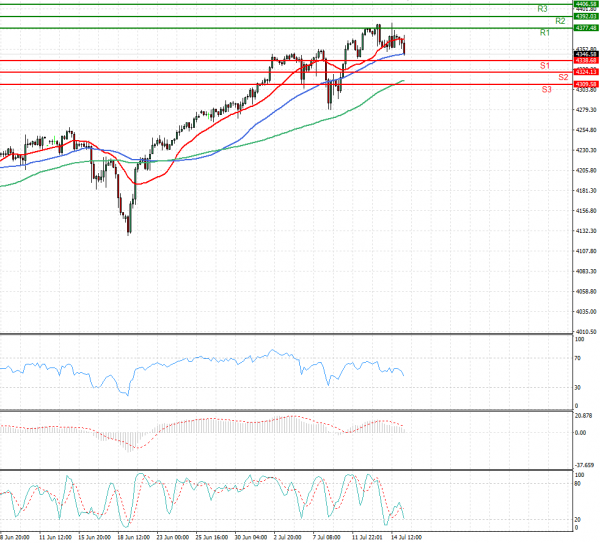
US Session Analysis for CFD Instruments 15/07/2021
Fundamental analysis
15 July, 2021
U.S. stock futures wobbled Thursday ahead of fresh data that will indicate the pace of recovery in the labor market and commentary from the Federal Reserve’s chief. Futures for the S&P 500 were treading water, while contracts tied to the Dow Jones Industrial Average slipped 0.2%. The S&P 500 ended Wednesday up just 0.1% after earlier hitting an intraday high. Contracts for the Nasdaq-100 edged up almost 0.4%, suggesting that large technology stocks may gain at the opening bell. The major indexes are hovering near all-time highs on signs of the economy rebounding and stronger-than-expected corporate earnings. But some money managers say stocks may struggle to grind higher in the coming weeks because an uptick in Covid-19 infections could threaten the global reopening. Concerns over how long higher inflation will linger and its impact on future earnings, as well as worry that the Federal Reserve may reduce its level of support, is also weighing on sentiment.