Fortrade Canada Ltd. as an order-execution only dealer is not permitted to provide you with any advice or recommendations. These Market Commentaries should not be construed as a recommendation, advice or any attempt by Fortrade Canada Ltd. to prompt or influence you in making an investment decision to purchase, sell, hold or exchange any security or to influence the timing of such activity. This content is produced by Fortrade Limited which is not registered in any capacity with any securities regulatory authority in Canada.
71% of retail investor accounts lose money when trading CFDs with this provider.
CFDs are complex instruments and come with a high risk of losing money rapidly due to leverage. 71% of retail investor accounts lose money when trading CFDs with this provider. You should consider whether you understand how CFDs work and whether you can afford to take the high risk of losing your money.
70.91% of retail investor accounts lose money when trading CFDs with this provider.
CFDs are complex instruments and come with a high risk of losing money rapidly due to leverage. 70.91% of retail investor accounts lose money when trading CFDs with this provider. You should consider whether you understand how CFDs work and whether you can afford to take the high risk of losing all your money. Read full risk warning.
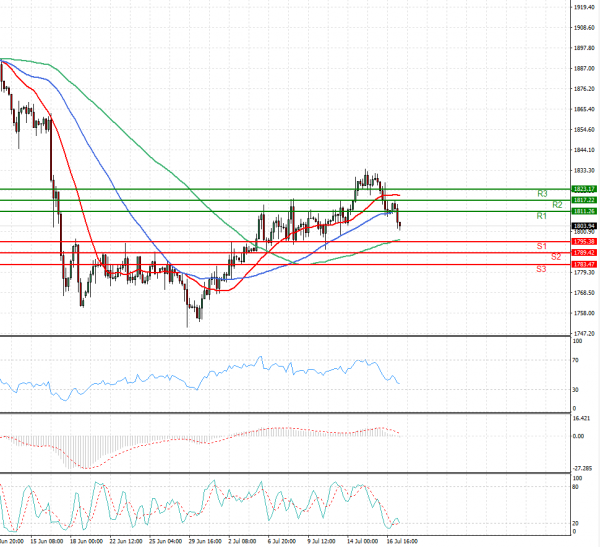
US Session Analysis for CFD Instruments 19/07/2021
Fundamental analysis
19 July, 2021
Gold prices edged lower on Monday as a fall in U.S. Treasury yields and concerns over a global economic recovery slowdown due to the spread of the Delta variant of the coronavirus lifted demand for the safe-haven metal. Many countries, particularly in Asia, are struggling to curb the highly contagious Delta variant of the coronavirus and have been forced into taking lockdown measures. Gold is used as a safe investment during times of political and financial uncertainty. Benchmark 10-year Treasury yields dropped to a near two-week low, reducing the opportunity cost of holding non-interest bearing gold.