Fortrade Canada Ltd. as an order-execution only dealer is not permitted to provide you with any advice or recommendations. These Market Commentaries should not be construed as a recommendation, advice or any attempt by Fortrade Canada Ltd. to prompt or influence you in making an investment decision to purchase, sell, hold or exchange any security or to influence the timing of such activity. This content is produced by Fortrade Limited which is not registered in any capacity with any securities regulatory authority in Canada.
71% of retail investor accounts lose money when trading CFDs with this provider.
CFDs are complex instruments and come with a high risk of losing money rapidly due to leverage. 71% of retail investor accounts lose money when trading CFDs with this provider. You should consider whether you understand how CFDs work and whether you can afford to take the high risk of losing your money.
70.91% of retail investor accounts lose money when trading CFDs with this provider.
CFDs are complex instruments and come with a high risk of losing money rapidly due to leverage. 70.91% of retail investor accounts lose money when trading CFDs with this provider. You should consider whether you understand how CFDs work and whether you can afford to take the high risk of losing all your money. Read full risk warning.
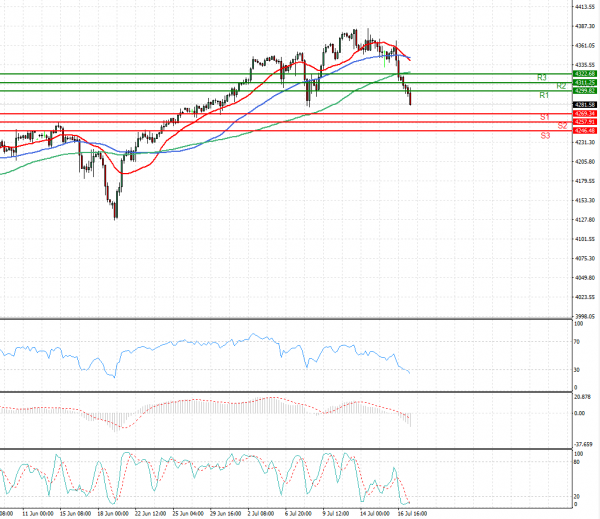
US Session Analysis for CFD Instruments 19/07/2021
Fundamental analysis
19 July, 2021
U.S. stock futures, oil prices and government bond yields slid, amid concerns that the spread of the delta coronavirus variant and rising inflation would hold back the global economy. Futures for the S&P 500 fell 0.8%, signaling opening losses for the broad stock-market gauge after it snapped a three-week winning streak Friday. Contracts for the Dow Jones Industrial Average dropped 1%. Futures on the technology-focused Nasdaq-100 fell 0.4%. In a sign that investors were sheltering in the safety of government bonds and other safe-haven assets, the yield on 10-year Treasury notes fell to 1.261% Monday, from 1.30% Friday. Yields fall when bond prices climb. The WSJ Dollar Index, which tracks the greenback against a basket of other currencies, rose 0.2%.