Fortrade Canada Ltd. as an order-execution only dealer is not permitted to provide you with any advice or recommendations. These Market Commentaries should not be construed as a recommendation, advice or any attempt by Fortrade Canada Ltd. to prompt or influence you in making an investment decision to purchase, sell, hold or exchange any security or to influence the timing of such activity. This content is produced by Fortrade Limited which is not registered in any capacity with any securities regulatory authority in Canada.
71% of retail investor accounts lose money when trading CFDs with this provider.
CFDs are complex instruments and come with a high risk of losing money rapidly due to leverage. 71% of retail investor accounts lose money when trading CFDs with this provider. You should consider whether you understand how CFDs work and whether you can afford to take the high risk of losing your money.
70.41% of retail investor accounts lose money when trading CFDs with this provider.
CFDs are complex instruments and come with a high risk of losing money rapidly due to leverage. 70.41% of retail investor accounts lose money when trading CFDs with this provider. You should consider whether you understand how CFDs work and whether you can afford to take the high risk of losing all your money. Read full risk warning.
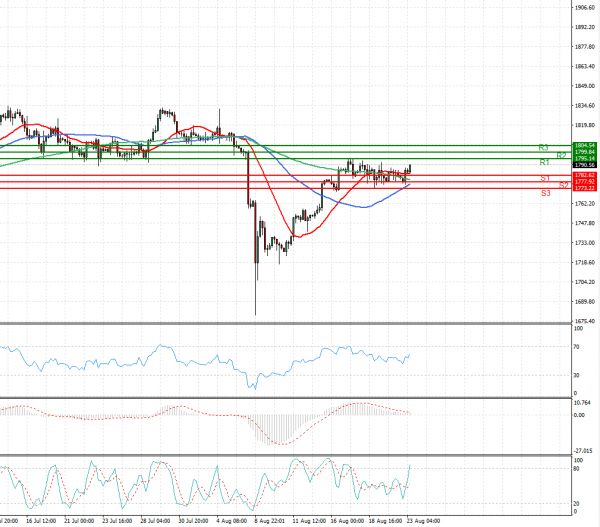
US Session Analysis for CFD Instruments 23/08/2021
Fundamental analysis
23 August, 2021
Gold prices rose on Monday after the U.S. dollar retreated from multi-month highs, while investor concerns that the Delta coronavirus variant could dampen the pace of global economic recovery also lifted bullion’s safe-haven appeal. The dollar index was down 0.1%, easing off the 9-1/2-month high hit last week, lifting gold’s allure for holders of other currencies. Dallas Federal Reserve President Robert Kaplan, a strong supporter for tapering stimulus, said on Friday he might need to adjust that view if the Delta variant slows economic growth materially. In the clearest sign yet of the impact of the Delta variant on the Fed’s plans, COVID-19 restrictions have prompted the U.S. central bank to schedule its annual economic symposium in Jackson Hole, Wyoming on Aug. 27 virtually and not in person as planned.