Fortrade Canada Ltd. as an order-execution only dealer is not permitted to provide you with any advice or recommendations. These Market Commentaries should not be construed as a recommendation, advice or any attempt by Fortrade Canada Ltd. to prompt or influence you in making an investment decision to purchase, sell, hold or exchange any security or to influence the timing of such activity. This content is produced by Fortrade Limited which is not registered in any capacity with any securities regulatory authority in Canada.
71% of retail investor accounts lose money when trading CFDs with this provider.
CFDs are complex instruments and come with a high risk of losing money rapidly due to leverage. 71% of retail investor accounts lose money when trading CFDs with this provider. You should consider whether you understand how CFDs work and whether you can afford to take the high risk of losing your money.
70.91% of retail investor accounts lose money when trading CFDs with this provider.
CFDs are complex instruments and come with a high risk of losing money rapidly due to leverage. 70.91% of retail investor accounts lose money when trading CFDs with this provider. You should consider whether you understand how CFDs work and whether you can afford to take the high risk of losing all your money. Read full risk warning.
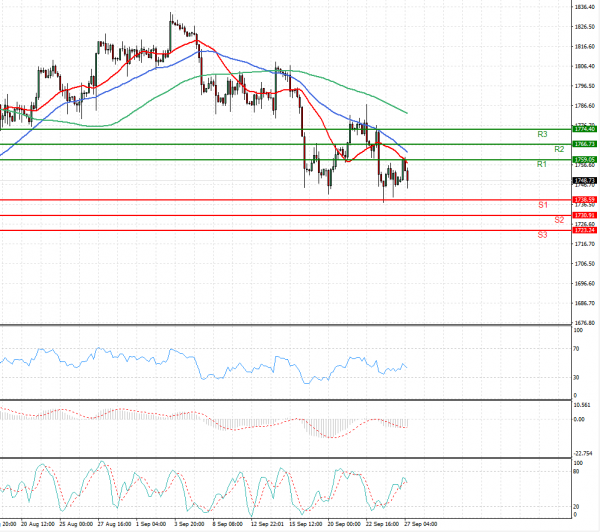
US Session Analysis for CFD Instruments 27/09/2021
Fundamental analysis
27 September, 2021
Gold prices firmed on Monday, propped up by a subdued dollar and slight retreat in the U.S. Treasury yields, with investors gearing up for speeches from U.S. Federal Reserve policymakers this week for cues on the central bank’s rate hike timeline. The dollar index softened, making bullion cheaper for holders of other currencies. Meanwhile the benchmark 10-year Treasury yields eased after hitting their highest since early-July. A slew of Fed officials are due to speak this week including Chairman Jerome Powell, who will testify this week before Congress on the central bank’s policy response to the pandemic.