Fortrade Canada Ltd. as an order-execution only dealer is not permitted to provide you with any advice or recommendations. These Market Commentaries should not be construed as a recommendation, advice or any attempt by Fortrade Canada Ltd. to prompt or influence you in making an investment decision to purchase, sell, hold or exchange any security or to influence the timing of such activity. This content is produced by Fortrade Limited which is not registered in any capacity with any securities regulatory authority in Canada.
71% of retail investor accounts lose money when trading CFDs with this provider.
CFDs are complex instruments and come with a high risk of losing money rapidly due to leverage. 71% of retail investor accounts lose money when trading CFDs with this provider. You should consider whether you understand how CFDs work and whether you can afford to take the high risk of losing your money.
70.91% of retail investor accounts lose money when trading CFDs with this provider.
CFDs are complex instruments and come with a high risk of losing money rapidly due to leverage. 70.91% of retail investor accounts lose money when trading CFDs with this provider. You should consider whether you understand how CFDs work and whether you can afford to take the high risk of losing all your money. Read full risk warning.
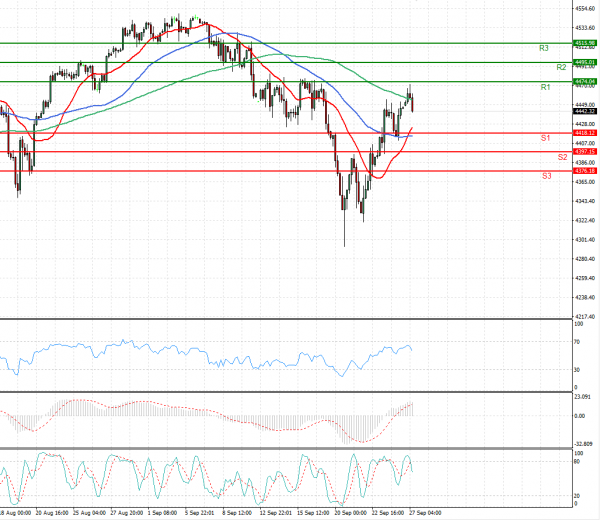
US Session Analysis for CFD Instruments 27/09/2021
Fundamental analysis
27 September, 2021
U.S. stock futures rose, and oil hit its highest level in nearly three years, as fears about China Evergrande Group debt problems waned and investors bet on further economic reopening from the pandemic. Stocks swung last week as fears about Evergrande’s debt problems weighed on markets. Despite the Chinese property developer missing a bond coupon payment, the S&P 500 still finished the week up 0.5%. Federal Reserve Chairman Jerome Powell helped boost confidence when he said the U.S. economy has recovered sufficiently for the central bank to potentially announce the start of bond-purchase tapering at its next meeting.