Fortrade Canada Ltd. as an order-execution only dealer is not permitted to provide you with any advice or recommendations. These Market Commentaries should not be construed as a recommendation, advice or any attempt by Fortrade Canada Ltd. to prompt or influence you in making an investment decision to purchase, sell, hold or exchange any security or to influence the timing of such activity. This content is produced by Fortrade Limited which is not registered in any capacity with any securities regulatory authority in Canada.
71% of retail investor accounts lose money when trading CFDs with this provider.
CFDs are complex instruments and come with a high risk of losing money rapidly due to leverage. 71% of retail investor accounts lose money when trading CFDs with this provider. You should consider whether you understand how CFDs work and whether you can afford to take the high risk of losing your money.
70.91% of retail investor accounts lose money when trading CFDs with this provider.
CFDs are complex instruments and come with a high risk of losing money rapidly due to leverage. 70.91% of retail investor accounts lose money when trading CFDs with this provider. You should consider whether you understand how CFDs work and whether you can afford to take the high risk of losing all your money. Read full risk warning.
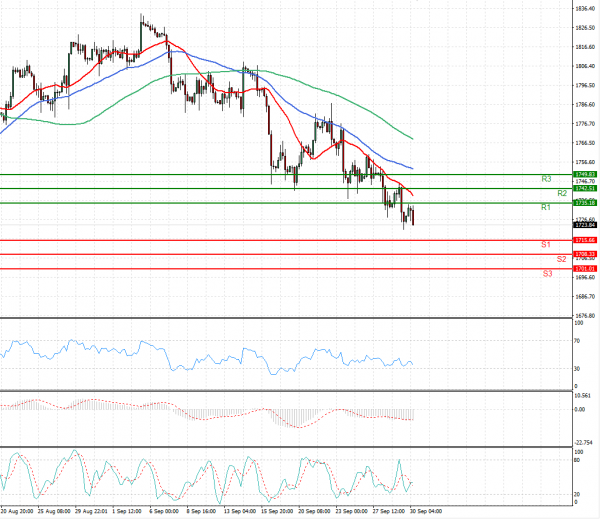
US Session Analysis for CFD Instruments 30/09/2021
Fundamental analysis
30 September, 2021
Gold stabilised on Thursday after two days of losses, helped by a slight pullback in the dollar, but gains were kept in check by expectations that the U.S. Federal Reserve would soon start tapering its monetary support. The dollar index paused on Thursday, but expectations that the Fed will start winding down its stimulus this year kept the U.S. currency near its highest in a year, diminishing gold’s appeal for holders’ of other currencies and putting it on course for a 2.2% quarterly dip. Benchmark U.S. 10-year Treasury yields too held above 1.5%, a level not seen since late-June.