Fortrade Canada Ltd. as an order-execution only dealer is not permitted to provide you with any advice or recommendations. These Market Commentaries should not be construed as a recommendation, advice or any attempt by Fortrade Canada Ltd. to prompt or influence you in making an investment decision to purchase, sell, hold or exchange any security or to influence the timing of such activity. This content is produced by Fortrade Limited which is not registered in any capacity with any securities regulatory authority in Canada.
71% of retail investor accounts lose money when trading CFDs with this provider.
CFDs are complex instruments and come with a high risk of losing money rapidly due to leverage. 71% of retail investor accounts lose money when trading CFDs with this provider. You should consider whether you understand how CFDs work and whether you can afford to take the high risk of losing your money.
70.91% of retail investor accounts lose money when trading CFDs with this provider.
CFDs are complex instruments and come with a high risk of losing money rapidly due to leverage. 70.91% of retail investor accounts lose money when trading CFDs with this provider. You should consider whether you understand how CFDs work and whether you can afford to take the high risk of losing all your money. Read full risk warning.
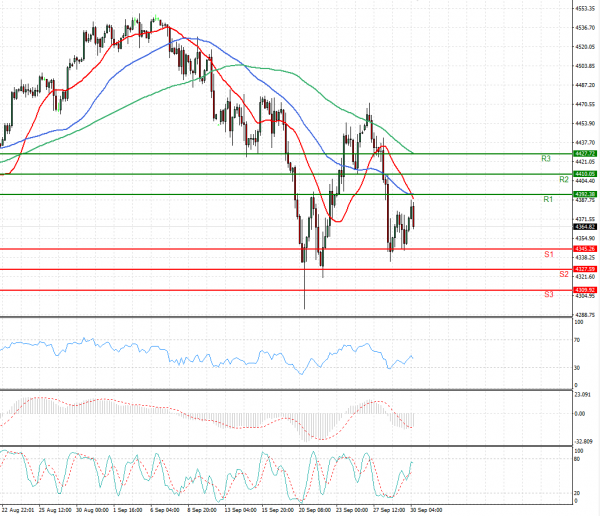
US Session Analysis for CFD Instruments 30/09/2021
Fundamental analysis
30 September, 2021
U.S. stock futures rose Thursday, indicating that the broader equity market would eke out gains for the third quarter despite recent whipsawed trading. Futures tied to the S&P 500 rose 0.5%, a signal that the broad market index will cement a sixth-consecutive quarter of gains. Through Wednesday’s close, the index added 1.4% in the third quarter. Futures for the Dow Jones Industrial Average climbed 0.5%. The index was down 0.3% this quarter as of Wednesday. Investors have had to navigate an uptick in Delta variant Covid-19 cases this quarter, alongside concerns that higher inflation—driven by surging energy prices—would stick around longer than expected. Also dogging markets were fears of contagion from debt-laden property developer China Evergrande Group.