Fortrade Canada Ltd. as an order-execution only dealer is not permitted to provide you with any advice or recommendations. These Market Commentaries should not be construed as a recommendation, advice or any attempt by Fortrade Canada Ltd. to prompt or influence you in making an investment decision to purchase, sell, hold or exchange any security or to influence the timing of such activity. This content is produced by Fortrade Limited which is not registered in any capacity with any securities regulatory authority in Canada.
69% of retail investor accounts lose money when trading CFDs with this provider.
CFDs are complex instruments and come with a high risk of losing money rapidly due to leverage. 69% of retail investor accounts lose money when trading CFDs with this provider. You should consider whether you understand how CFDs work and whether you can afford to take the high risk of losing your money.
70.88% of retail investor accounts lose money when trading CFDs with this provider.
CFDs are complex instruments and come with a high risk of losing money rapidly due to leverage. 70.88% of retail investor accounts lose money when trading CFDs with this provider. You should consider whether you understand how CFDs work and whether you can afford to take the high risk of losing all your money. Read full risk warning.
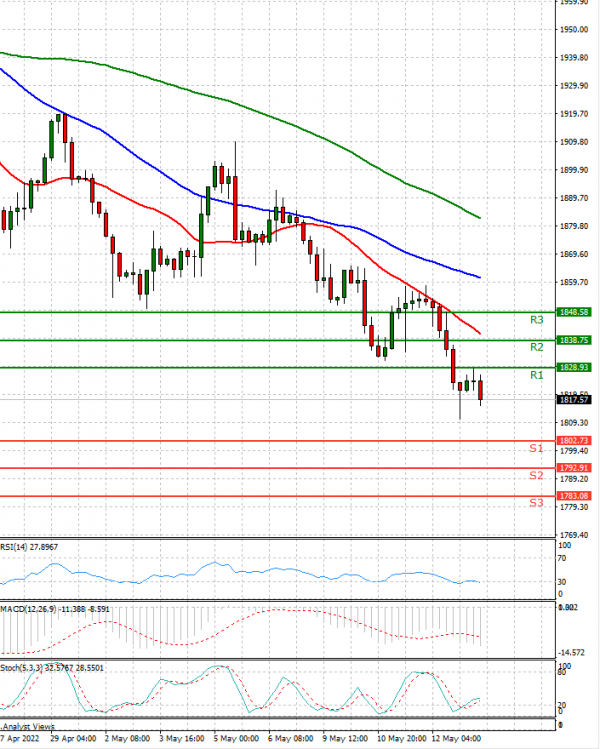
US Session Analysis for CFD Instruments 13/05/2022
Fundamental analysis
13 May, 2022
Gold prices hovered near a three-month low on Friday and were set for their fourth straight weekly fall, as the strongest dollar in two decades dampened demand for greenback-priced bullion.