Fortrade Canada Ltd. as an order-execution only dealer is not permitted to provide you with any advice or recommendations. These Market Commentaries should not be construed as a recommendation, advice or any attempt by Fortrade Canada Ltd. to prompt or influence you in making an investment decision to purchase, sell, hold or exchange any security or to influence the timing of such activity. This content is produced by Fortrade Limited which is not registered in any capacity with any securities regulatory authority in Canada.
69% of retail investor accounts lose money when trading CFDs with this provider.
CFDs are complex instruments and come with a high risk of losing money rapidly due to leverage. 69% of retail investor accounts lose money when trading CFDs with this provider. You should consider whether you understand how CFDs work and whether you can afford to take the high risk of losing your money.
70.88% of retail investor accounts lose money when trading CFDs with this provider.
CFDs are complex instruments and come with a high risk of losing money rapidly due to leverage. 70.88% of retail investor accounts lose money when trading CFDs with this provider. You should consider whether you understand how CFDs work and whether you can afford to take the high risk of losing all your money. Read full risk warning.
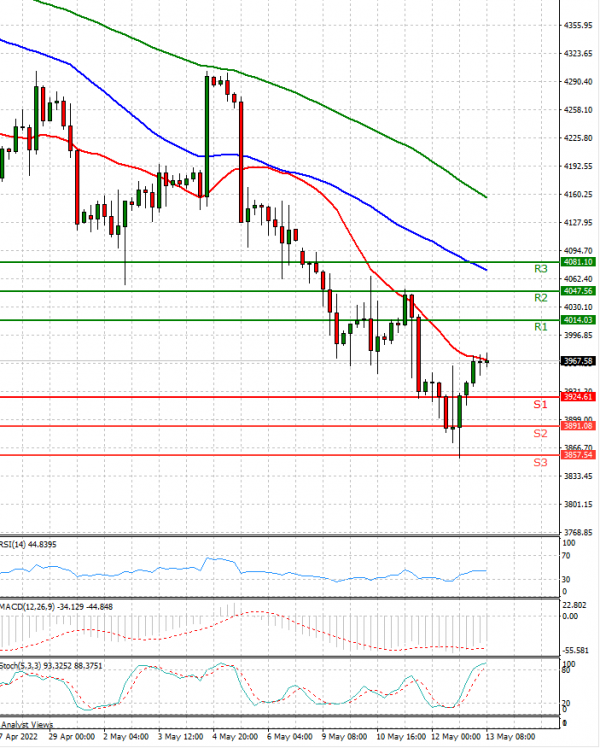
US Session Analysis for CFD Instruments 13/05/2022
Fundamental analysis
13 May, 2022
U.S. stock futures rose, suggesting markets could stage a relief rally at the end of a punishing week of losses across major indexes. Futures tied to the S&P 500 rose 1.2% Friday. Contracts for technology-heavy Nasdaq-100 jumped 1.8%. On Thursday, stocks finished mixed after major indexes staged a late-session rally that ultimately pushed the Nasdaq Composite into positive territory. Even with possible gains on the horizon when the market opens Friday, U.S. stocks are still on course to end the week sharply lower. As of Thursday’s close, the S&P 500 and Nasdaq Composite were down 4.7% and 6.4% for the week, respectively, on pace for their worst weekly performance since late January.