CFDs are complex instruments and come with a high risk of losing money rapidly due to leverage. 71% of retail investor accounts lose money when trading CFDs with this provider. You should consider whether you understand how CFDs work and whether you can afford to take the high risk of losing your money.
CFDs are complex instruments and come with a high risk of losing money rapidly due to leverage. 70.91% of retail investor accounts lose money when trading CFDs with this provider. You should consider whether you understand how CFDs work and whether you can afford to take the high risk of losing all your money. Read full risk warning.

Gold - Usd Dollar Analysis

US Session Analysis for CFD Instruments 20/11/2023

Fundamental analysis

20 November, 2023

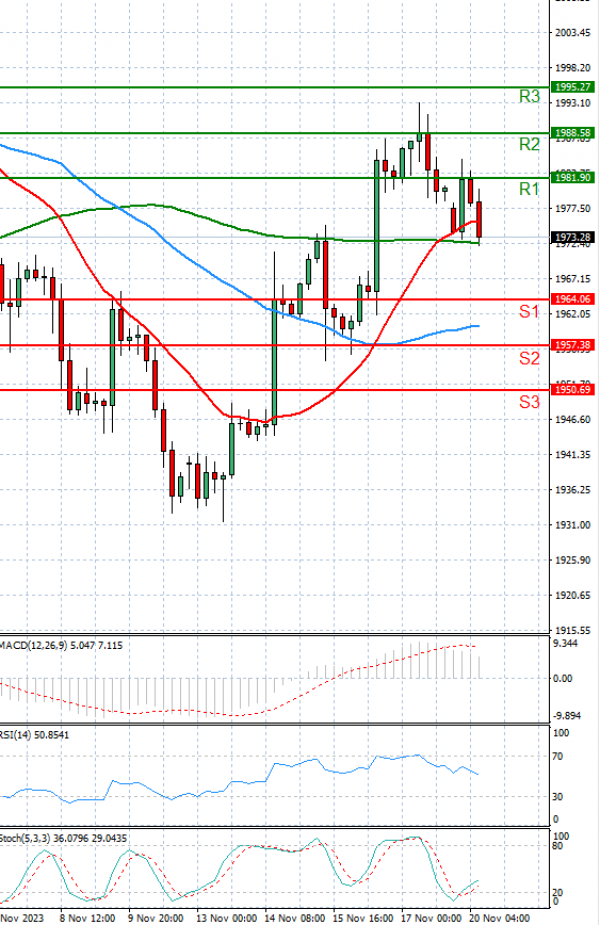
Gold price is trading lower to at 1977, early Monday.
Investors turned optimistic after Chinese officials vowed to roll out more policy support for the country’s beleaguered real estate sector. This, in turn, is seen as a key factor undermining the safe-haven precious metal, though the downside seems cushioned.
Investors now seem convinced that the Federal Reserve (Fed) is done with its policy tightening campaign and will maintain the status quo at its December 2023 meeting. Moreover, the markets are currently pricing in the possibility that the Fed could begin cutting interest rates as soon as March 2024. This, in turn, dragged the US Dollar (USD) to its lowest level since August 31, which, along with the worsening global economic outlook and geopolitical risks, could lend support to the Gold price.

Technical analysis

Gold - Usd Dollar Analysis Technical analysis 20/11/2023
Time Frame: 1 hour

GOLD Support & Resistance Table - 20/11/2023

Support & Resistance Level Explanation
Resistance 2 1988.583 Daily R2
Resistance 1 1981.896 Daily R1
Support 1 1964.064 Daily S1
Support 2 1957.377 Daily S2

GOLD Indicator Table - 20/11/2023

Indicator Signal
SMA 20 Sell
SMA 50 Buy
SMA 100 Sell
MACD( 12;26;9) Buy
RSI (14) Sell
Stochastic ( 9;6;3) Sell

GOLD Indicator / Period Table - 20/11/2023

Indicator / Period Day - SellWeek - BuyMonth - Buy
MACD( 12;26;9) Buy BuySell
RSI (14) Buy BuyBuy
SMA 20 Buy NeutralBuy

GOLD 20/11/2023 - Reference Price : 1972.980

Sell
Simple Moving AverageBuy (1)Sell (2)
Technical Indicators - OscillatorsBuy (1)Sell (2)
Share It With Your Network
GOLD Chart
Update Time: -
Highest
Lowest
1M 5M H D W
Prices are loading..
Ready for trading?Start Now