Fortrade Canada Ltd. as an order-execution only dealer is not permitted to provide you with any advice or recommendations. These Market Commentaries should not be construed as a recommendation, advice or any attempt by Fortrade Canada Ltd. to prompt or influence you in making an investment decision to purchase, sell, hold or exchange any security or to influence the timing of such activity. This content is produced by Fortrade Limited which is not registered in any capacity with any securities regulatory authority in Canada.
70% of retail investor accounts lose money when trading CFDs with this provider.
CFDs are complex instruments and come with a high risk of losing money rapidly due to leverage. 70% of retail investor accounts lose money when trading CFDs with this provider. You should consider whether you understand how CFDs work and whether you can afford to take the high risk of losing your money.
70.41% of retail investor accounts lose money when trading CFDs with this provider.
CFDs are complex instruments and come with a high risk of losing money rapidly due to leverage. 70.41% of retail investor accounts lose money when trading CFDs with this provider. You should consider whether you understand how CFDs work and whether you can afford to take the high risk of losing all your money. Read full risk warning.
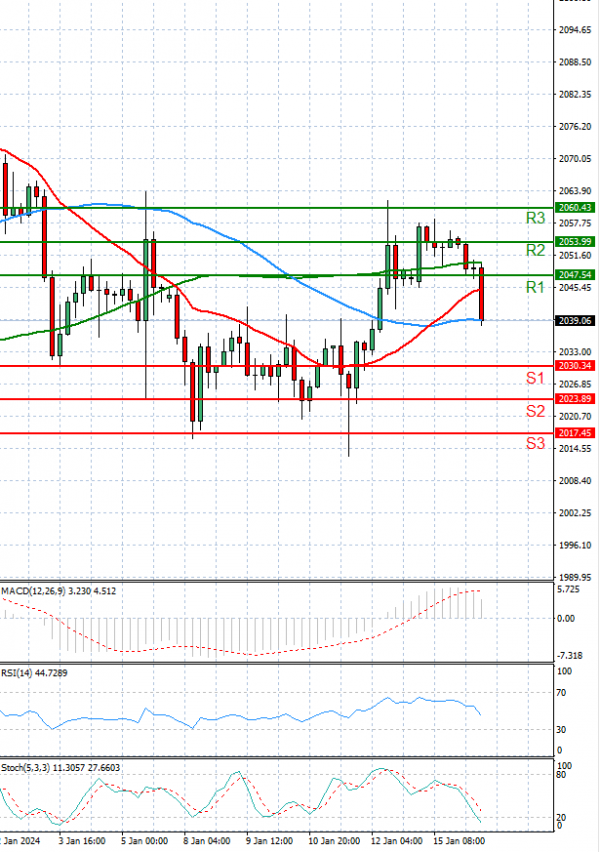
US Session Analysis for CFD Instruments 16/01/2024
Fundamental analysis
16 January, 2024
Gold prices are trading today at around 2,040.
Gold prices fell slightly during European trading as investors and markets patiently await cues from the Fed this week with a couple of Fed officials scheduled to speak throughout the week. This will provide further guidance with regards to how soon the Fed expects to cut rates.
Gold prices are still supported by demand for its safe-haven properties as tensions in the Middle East and globally are escalating. Further uncertainty which supports the price of Gold are the numerous elections taking place throughout the year most notably the US election in November.