Fortrade Canada Ltd. as an order-execution only dealer is not permitted to provide you with any advice or recommendations. These Market Commentaries should not be construed as a recommendation, advice or any attempt by Fortrade Canada Ltd. to prompt or influence you in making an investment decision to purchase, sell, hold or exchange any security or to influence the timing of such activity. This content is produced by Fortrade Limited which is not registered in any capacity with any securities regulatory authority in Canada.
70% of retail investor accounts lose money when trading CFDs with this provider.
CFDs are complex instruments and come with a high risk of losing money rapidly due to leverage. 70% of retail investor accounts lose money when trading CFDs with this provider. You should consider whether you understand how CFDs work and whether you can afford to take the high risk of losing your money.
70.41% of retail investor accounts lose money when trading CFDs with this provider.
CFDs are complex instruments and come with a high risk of losing money rapidly due to leverage. 70.41% of retail investor accounts lose money when trading CFDs with this provider. You should consider whether you understand how CFDs work and whether you can afford to take the high risk of losing all your money. Read full risk warning.
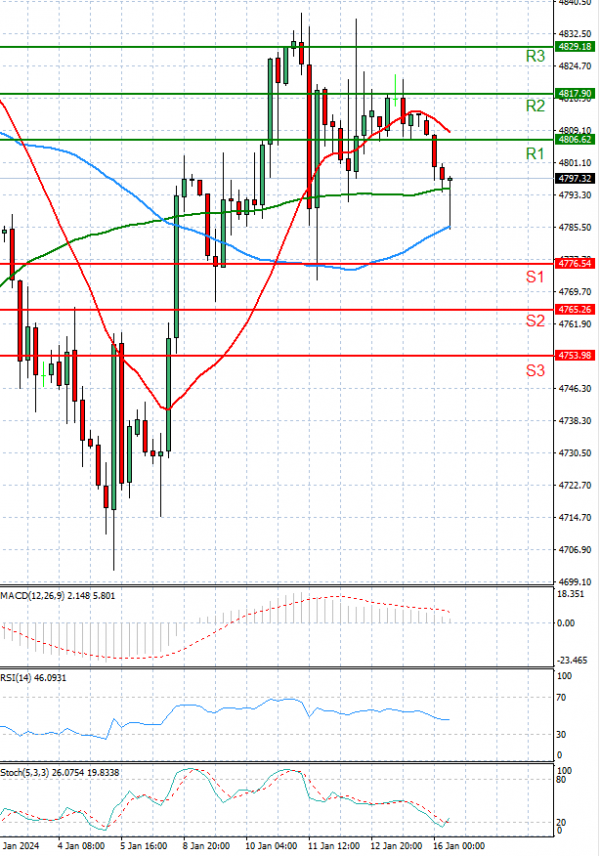
US Session Analysis for CFD Instruments 16/01/2024
Fundamental analysis
16 January, 2024
The USA500 is trading currently at 4,754.
US stock markets were closed yesterday for Martin Luther King Day.
U.S. stock futures were lower Monday night as Wall Street awaits December retail sales data due Wednesday and bank earnings that will provide a better picture of the state of the American consumer.
In addition, markets will patiently be awaiting further Fed cues this week and several Fed officials are set to deliver speeches which could provide further guidance as to when the Fed expects to start cutting interest rates.