CFDs are complex instruments and come with a high risk of losing money rapidly due to leverage. 77% of retail investor accounts lose money when trading CFDs with this provider. You should consider whether you understand how CFDs work and whether you can afford to take the high risk of losing your money.
CFDs are complex instruments and come with a high risk of losing money rapidly due to leverage. 76% of retail investor accounts lose money when trading CFDs with this provider. You should consider whether you can afford to take the high risk of losing your money.

Gold - Usd Dollar Analysis

US Session Analysis for CFD Instruments 15/04/2024

Fundamental analysis

15 April, 2024

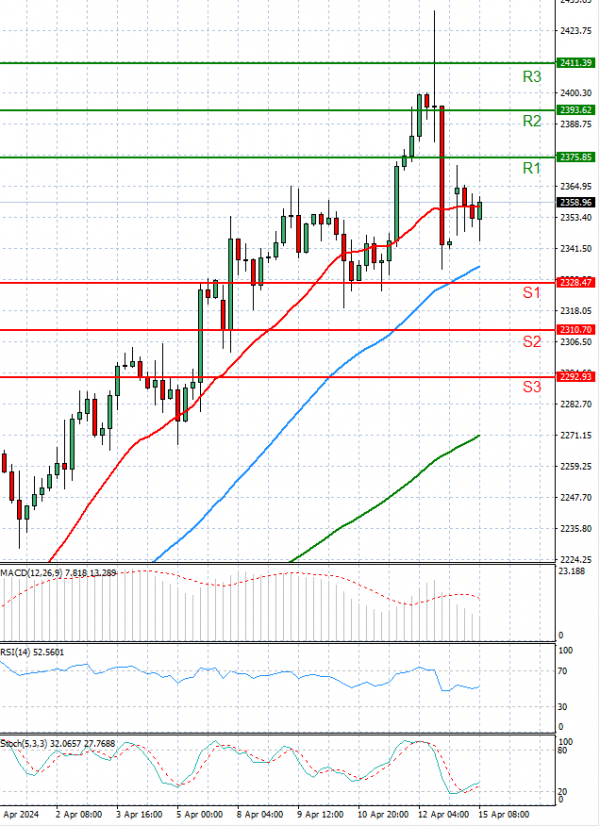
Gold prices are trading in today’s European session around 2340 levels.

Early Monday saw a slight drop in gold prices as investors assessed global risks after Iran's attacks on Israel. Gold fell slightly in early trading, having spiked to a record high above $2,400 on Friday due to Middle East escalation fears. Though the conflict didn't escalate as much as feared, gold retreated at the week's start.

Despite this, gold remains near record levels, indicating ongoing investor nervousness. A wider Middle East conflict could spike energy prices and disrupt central banks' inflation efforts. Gold, a haven asset, will likely stay in focus as markets await potential Israeli retaliation.

Technical analysis

Gold - Usd Dollar Analysis Technical analysis 15/04/2024
Time Frame: 1 hour

GOLD Support & Resistance Table - 15/04/2024

Support & Resistance Level Explanation
Resistance 2 2393.62 Daily R2
Resistance 1 2375.85 Daily R1
Support 1 2328.47 Daily S1
Support 2 2310.70 Daily S2

GOLD Indicator Table - 15/04/2024

Indicator Signal
SMA 20 Sell
SMA 50 Buy
SMA 100 Buy
MACD( 12;26;9) Buy
RSI (14) Sell
Stochastic ( 9;6;3) Sell

GOLD Indicator / Period Table - 15/04/2024

Indicator / Period Day - SellWeek - BuyMonth - Buy
MACD( 12;26;9) Buy BuyBuy
RSI (14) Sell BuyBuy
SMA 20 Buy BuyBuy

GOLD 15/04/2024 - Reference Price : 2352.16

Sell
Simple Moving AverageBuy (2)Sell (1)
Technical Indicators - OscillatorsBuy (1)Sell (2)
Share It With Your Network
GOLD Chart
Update Time: -
Highest
Lowest
1M 5M H D W
Prices are loading..
Ready for trading?Start Now