Fortrade Canada Ltd. as an order-execution only dealer is not permitted to provide you with any advice or recommendations. These Market Commentaries should not be construed as a recommendation, advice or any attempt by Fortrade Canada Ltd. to prompt or influence you in making an investment decision to purchase, sell, hold or exchange any security or to influence the timing of such activity. This content is produced by Fortrade Limited which is not registered in any capacity with any securities regulatory authority in Canada.
71% of retail investor accounts lose money when trading CFDs with this provider.
CFDs are complex instruments and come with a high risk of losing money rapidly due to leverage. 71% of retail investor accounts lose money when trading CFDs with this provider. You should consider whether you understand how CFDs work and whether you can afford to take the high risk of losing your money.
70.41% of retail investor accounts lose money when trading CFDs with this provider.
CFDs are complex instruments and come with a high risk of losing money rapidly due to leverage. 70.41% of retail investor accounts lose money when trading CFDs with this provider. You should consider whether you understand how CFDs work and whether you can afford to take the high risk of losing all your money. Read full risk warning.
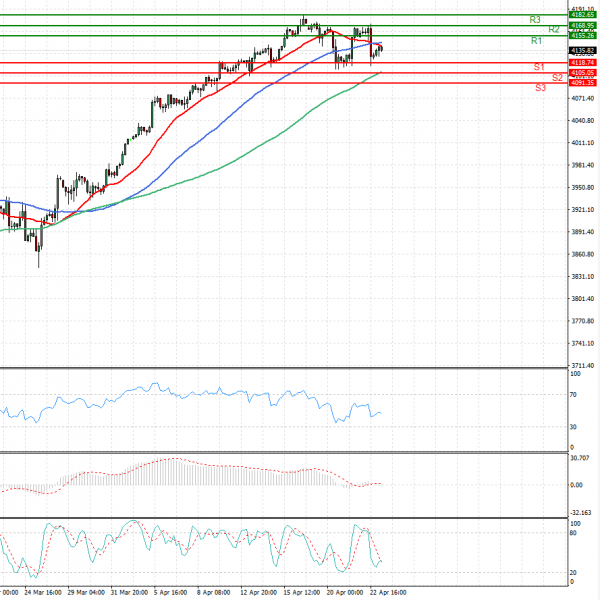
US Session Analysis for CFD Instruments 23/04/2021
Fundamental analysis
23 April, 2021
U.S. stock futures edged up as investors assessed fresh data on how manufacturing and services world-wide are faring in the second quarter. Futures tied to the S&P 500 ticked 0.2% higher, suggesting the broad-market index may regain some ground. The gauge dropped 0.9% Thursday on reports that President Biden is considering higher capital-gains taxes for the wealthiest Americans, and is on track to end a four-week streak of gains. Nasdaq-100 futures edged up 0.2%, pointing to muted gains in technology stocks after the opening bell. Stocks have been choppy this week as sentiment wavered between concerns about fresh waves of Covid-19 infections around the world and optimism prompted by promising economic data. Weekly jobless claims last week hit the lowest point since the pandemic began, indicating that the U.S. labor market is improving.