Fortrade Canada Ltd. as an order-execution only dealer is not permitted to provide you with any advice or recommendations. These Market Commentaries should not be construed as a recommendation, advice or any attempt by Fortrade Canada Ltd. to prompt or influence you in making an investment decision to purchase, sell, hold or exchange any security or to influence the timing of such activity. This content is produced by Fortrade Limited which is not registered in any capacity with any securities regulatory authority in Canada.
71% of retail investor accounts lose money when trading CFDs with this provider.
CFDs are complex instruments and come with a high risk of losing money rapidly due to leverage. 71% of retail investor accounts lose money when trading CFDs with this provider. You should consider whether you understand how CFDs work and whether you can afford to take the high risk of losing your money.
70.41% of retail investor accounts lose money when trading CFDs with this provider.
CFDs are complex instruments and come with a high risk of losing money rapidly due to leverage. 70.41% of retail investor accounts lose money when trading CFDs with this provider. You should consider whether you understand how CFDs work and whether you can afford to take the high risk of losing all your money. Read full risk warning.
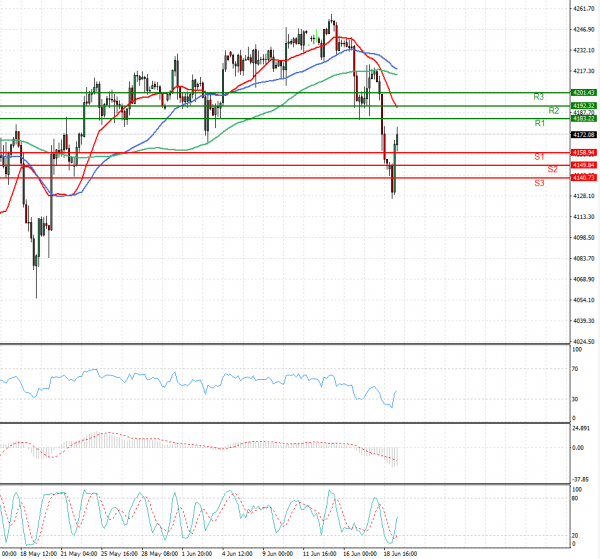
US Session Analysis for CFD Instruments 21/06/2021
Fundamental analysis
21 June, 2021
U.S. stock futures rose Monday, while the gap between short-dated and long-term bond yields narrowed, reflecting the complex calculations investors are making as they take into account the prospect of rising interest rates. Futures tied to the Dow Jones Industrial Average advanced 0.6%, pointing to a rebound after the gauge’s tumultuous drop last week. By the Friday close, the blue-chips index had suffered its largest decline since the week ended Oct. 30. Contracts linked to the S&P 500 climbed 0.4% Monday, while Nasdaq-100 futures rose 0.5%, pointing to gains in large technology stocks at the opening bell.