Fortrade Canada Ltd. as an order-execution only dealer is not permitted to provide you with any advice or recommendations. These Market Commentaries should not be construed as a recommendation, advice or any attempt by Fortrade Canada Ltd. to prompt or influence you in making an investment decision to purchase, sell, hold or exchange any security or to influence the timing of such activity. This content is produced by Fortrade Limited which is not registered in any capacity with any securities regulatory authority in Canada.
69% of retail investor accounts lose money when trading CFDs with this provider.
CFDs are complex instruments and come with a high risk of losing money rapidly due to leverage. 69% of retail investor accounts lose money when trading CFDs with this provider. You should consider whether you understand how CFDs work and whether you can afford to take the high risk of losing your money.
70.88% of retail investor accounts lose money when trading CFDs with this provider.
CFDs are complex instruments and come with a high risk of losing money rapidly due to leverage. 70.88% of retail investor accounts lose money when trading CFDs with this provider. You should consider whether you understand how CFDs work and whether you can afford to take the high risk of losing all your money. Read full risk warning.
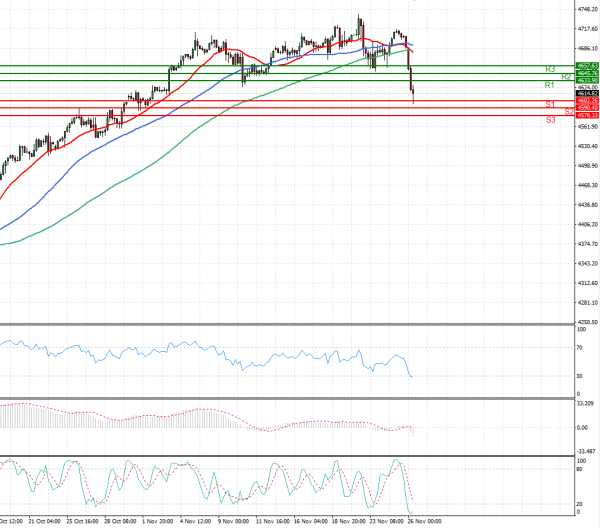
US Session Analysis for CFD Instruments 26/11/2021
Fundamental analysis
26 November, 2021
U.S. stock futures fell after South Africa raised the alarm over a new, fast-spreading strain of the coronavirus, triggering concern about the potential for new travel restrictions or other curbs that could limit economic activity. With U.S. stocks set for a shortened trading session after a one-day Thanksgiving break, market participants said the global moves were likely amplified by thin trading volumes. Stock-index futures lost ground, suggesting U.S. markets could come under pressure when they reopen. S&P 500 futures dropped 1.9%, while futures tied to the Dow Jones Industrial Average lost about 2.3%.