77% of retail investor accounts lose money when trading CFDs with this provider.
CFDs are complex instruments and come with a high risk of losing money rapidly due to leverage. 77% of retail investor accounts lose money when trading CFDs with this provider. You should consider whether you understand how CFDs work and whether you can afford to take the high risk of losing your money.
76% of retail investor accounts lose money when trading CFDs with this provider.
CFDs are complex instruments and come with a high risk of losing money rapidly due to leverage. 76% of retail investor accounts lose money when trading CFDs with this provider. You should consider whether you can afford to take the high risk of losing your money.
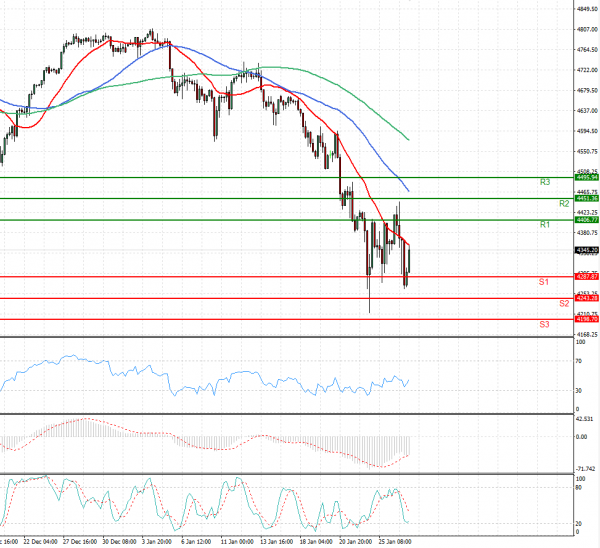
US Session Analysis for CFD Instruments 27/01/2022
Fundamental analysis
27 January, 2022
Stock futures swung as investors worried about the speed at which the Federal Reserve would move to lift interest rates, and awaited more earnings from major consumer and technology companies. Futures tied to the S&P 500 rose 0.1% Thursday after declining more than 1% earlier, pointing to another choppy day for the index.