77% of retail investor accounts lose money when trading CFDs with this provider.
CFDs are complex instruments and come with a high risk of losing money rapidly due to leverage. 77% of retail investor accounts lose money when trading CFDs with this provider. You should consider whether you understand how CFDs work and whether you can afford to take the high risk of losing your money.
76% of retail investor accounts lose money when trading CFDs with this provider.
CFDs are complex instruments and come with a high risk of losing money rapidly due to leverage. 76% of retail investor accounts lose money when trading CFDs with this provider. You should consider whether you can afford to take the high risk of losing your money.
US Session Analysis for CFD Instruments 27/01/2022
Fundamental analysis
27 January, 2022
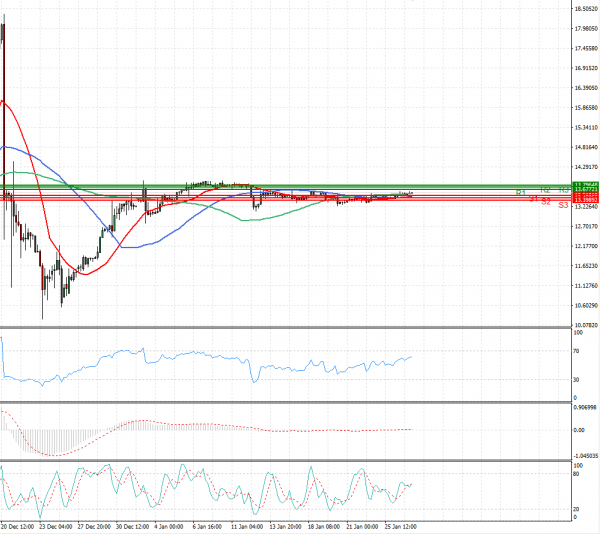
The USD/TRY pair increased by Thursday lunchtime. It is now trading at 13.6181. The lira continued to fall after Turkey's central bank hiked its year-end annual inflation forecast to 23.2%, from 11.8% previously, and its chief dismissed the idea that a series of unorthodox interest rate cuts sent inflation soaring and the lira tumbling.