CFDs are complex instruments and come with a high risk of losing money rapidly due to leverage. 71% of retail investor accounts lose money when trading CFDs with this provider. You should consider whether you understand how CFDs work and whether you can afford to take the high risk of losing your money.
CFDs are complex instruments and come with a high risk of losing money rapidly due to leverage. 70.91% of retail investor accounts lose money when trading CFDs with this provider. You should consider whether you understand how CFDs work and whether you can afford to take the high risk of losing all your money. Read full risk warning.

USA500 Analysis

US Session Analysis for CFD Instruments 18/03/2024

Fundamental analysis

18 March, 2024

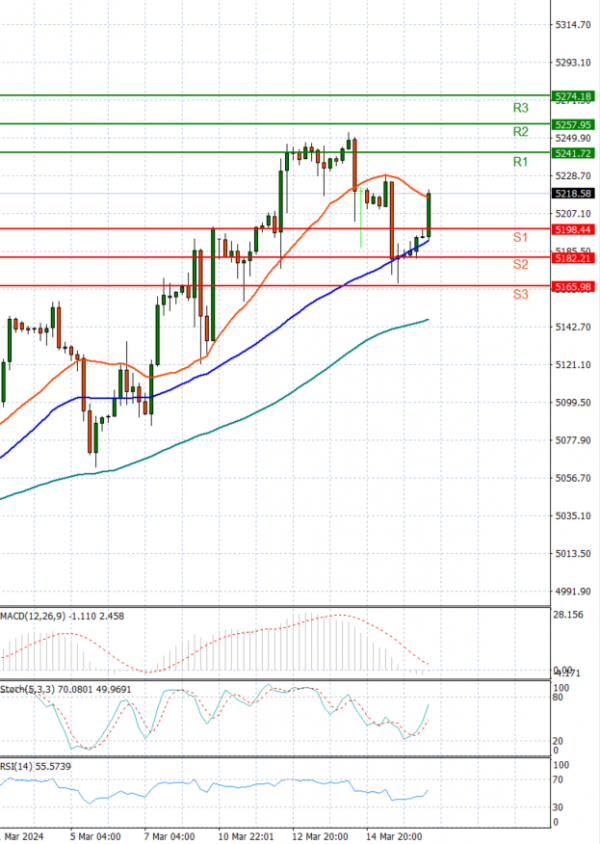
The USA500 is currently trading just above 5,100 levels.

Dow Jones futures edged lower Monday morning, while S&P 500 futures and Nasdaq futures rose, buoyed by Google and Nvidia stock. The Federal Reserve meeting and AI events from Nvidia and Microsoft headline the coming week.

Dow Jones futures fell. S&P 500 futures climbed 0.4% and Nasdaq 100 futures rose 0.75%.

Technical analysis

USA500 Analysis Technical analysis 18/03/2024
Time Frame: 1 hour

USA500 Support & Resistance Table - 18/03/2024

Support & Resistance Level Explanation
Resistance 2 5257.95 Daily R2
Resistance 1 5241.72 Daily R1
Support 1 5198.44 Daily S1
Support 2 5182.21 Daily S2

USA500 Indicator Table - 18/03/2024

Indicator Signal
SMA 20 Buy
SMA 50 Buy
SMA 100 Buy
MACD( 12;26;9) Buy
RSI (14) Buy
Stochastic ( 9;6;3) Buy

USA500 Indicator / Period Table - 18/03/2024

Indicator / Period Day - BuyWeek - BuyMonth - Buy
MACD( 12;26;9) Buy BuyBuy
RSI (14) Buy BuyBuy
SMA 20 Buy BuyBuy

USA500 18/03/2024 - Reference Price : 5220.08

Buy
Simple Moving AverageBuy (3)Sell (0)
Technical Indicators - OscillatorsBuy (3)Sell (0)
Share It With Your Network
USA500 Chart
Update Time: -
Highest
Lowest
1M 5M H D W
Prices are loading..
Ready for trading?Start Now