CFDs are complex instruments and come with a high risk of losing money rapidly due to leverage. 77% of retail investor accounts lose money when trading CFDs with this provider. You should consider whether you understand how CFDs work and whether you can afford to take the high risk of losing your money.
CFDs are complex instruments and come with a high risk of losing money rapidly due to leverage. 76% of retail investor accounts lose money when trading CFDs with this provider. You should consider whether you can afford to take the high risk of losing your money.

USA500 Analysis

US Session Analysis for CFD Instruments 25/03/2024

Fundamental analysis

25 March, 2024

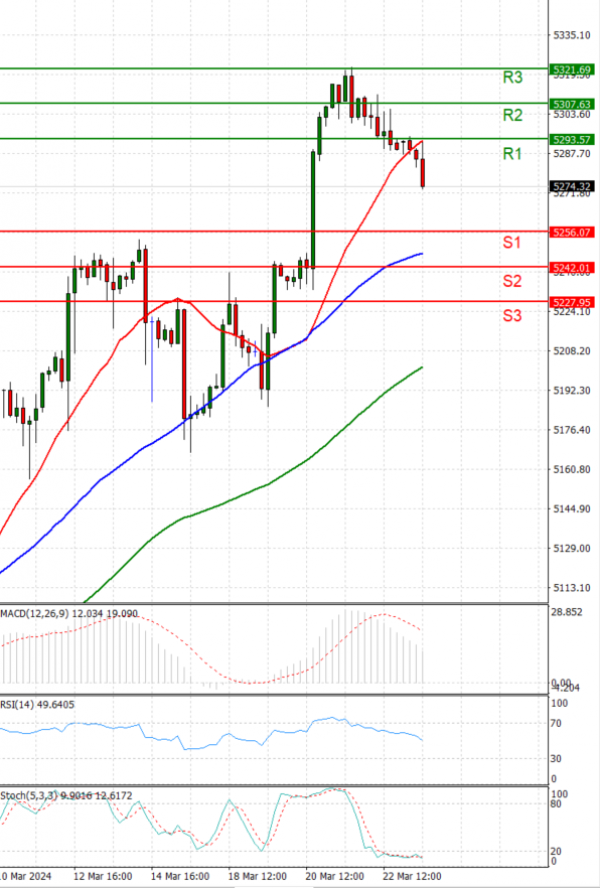
The USA500 is currently trading below 5,300 levels.

At the onset of a holiday-shortened week on Monday, U.S. stock index futures slightly declined as investors anticipated speeches from Federal Reserve officials and a significant inflation indicator later in the week.

Last Friday, both the S&P 500 and the Dow, a leading blue-chip index, recorded their most substantial weekly percentage gains of the year, with the Fed maintaining its projection for three interest rate reductions in 2024.

Presently, traders assess a 75% likelihood of the Fed implementing the initial cut in June, as indicated by the CME FedWatch tool, marking an increase from around 55% at the beginning of last week.

Dow futures were down 44 points, or 0.11%, S&P 500 futures were down 5.75 points, or 0.11%, and Nasdaq 100 futures were down 32.75 points, or 0.18%.

Technical analysis

USA500 Analysis Technical analysis 25/03/2024
Time Frame: 1 hour

USA500 Support & Resistance Table - 25/03/2024

Support & Resistance Level Explanation
Resistance 2 5307.63 Daily R2
Resistance 1 5293.57 Daily R1
Support 1 5256.07 Daily S1
Support 2 5242.01 Daily S2

USA500 Indicator Table - 25/03/2024

Indicator Signal
SMA 20 Sell
SMA 50 Buy
SMA 100 Buy
MACD( 12;26;9) Buy
RSI (14) Sell
Stochastic ( 9;6;3) Sell

USA500 Indicator / Period Table - 25/03/2024

Indicator / Period Day - SellWeek - BuyMonth - Buy
MACD( 12;26;9) Buy BuyBuy
RSI (14) Sell BuyBuy
SMA 20 Sell BuyBuy

USA500 25/03/2024 - Reference Price : 5274.82

Sell
Simple Moving AverageBuy (2)Sell (1)
Technical Indicators - OscillatorsBuy (1)Sell (2)
Share It With Your Network
USA500 Chart
Update Time: -
Highest
Lowest
1M 5M H D W
Prices are loading..
Ready for trading?Start Now