Fortrade Canada Ltd. as an order-execution only dealer is not permitted to provide you with any advice or recommendations. These Market Commentaries should not be construed as a recommendation, advice or any attempt by Fortrade Canada Ltd. to prompt or influence you in making an investment decision to purchase, sell, hold or exchange any security or to influence the timing of such activity. This content is produced by Fortrade Limited which is not registered in any capacity with any securities regulatory authority in Canada.
71% of retail investor accounts lose money when trading CFDs with this provider.
CFDs are complex instruments and come with a high risk of losing money rapidly due to leverage. 71% of retail investor accounts lose money when trading CFDs with this provider. You should consider whether you understand how CFDs work and whether you can afford to take the high risk of losing your money.
70.91% of retail investor accounts lose money when trading CFDs with this provider.
CFDs are complex instruments and come with a high risk of losing money rapidly due to leverage. 70.91% of retail investor accounts lose money when trading CFDs with this provider. You should consider whether you understand how CFDs work and whether you can afford to take the high risk of losing all your money. Read full risk warning.
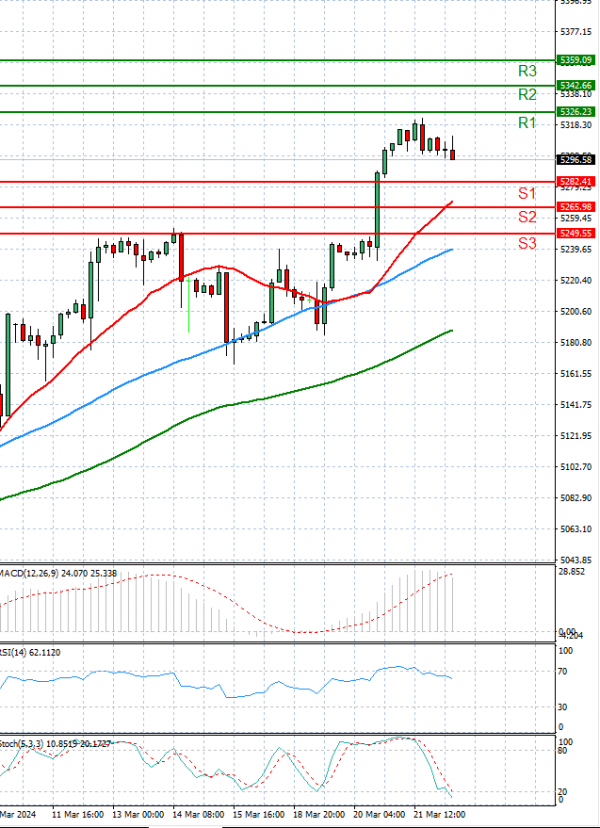
US Session Analysis for CFD Instruments 26/03/2024
Fundamental analysis
26 March, 2024
The USA500 is currently trading above 5,200 levels.
Ahead of the opening bell on Tuesday, US futures showed a slight uptick, marking a subdued week for Wall Street as investors anticipate the release of one of the Federal Reserve's favoured inflation indicators on Friday — the personal consumption expenditures (PCE) price index.
S&P 500 futures increased by 0.35%, rebounding after a decline on Monday. Nasdaq 100 futures rose by 0.48%, while Dow Jones Industrial Average futures saw a modest gain of 0.19%.
Following a buoyant atmosphere last week, during which all three indexes reached new record closing highs, markets are currently pausing as investors await further insights from the Federal Reserve.