CFDs are complex instruments and come with a high risk of losing money rapidly due to leverage. 71% of retail investor accounts lose money when trading CFDs with this provider. You should consider whether you understand how CFDs work and whether you can afford to take the high risk of losing your money.
CFDs are complex instruments and come with a high risk of losing money rapidly due to leverage. 70.91% of retail investor accounts lose money when trading CFDs with this provider. You should consider whether you understand how CFDs work and whether you can afford to take the high risk of losing all your money. Read full risk warning.

USA500 Analysis

US Session Analysis for CFD Instruments 03/01/2025

Fundamental analysis

03 January, 2025

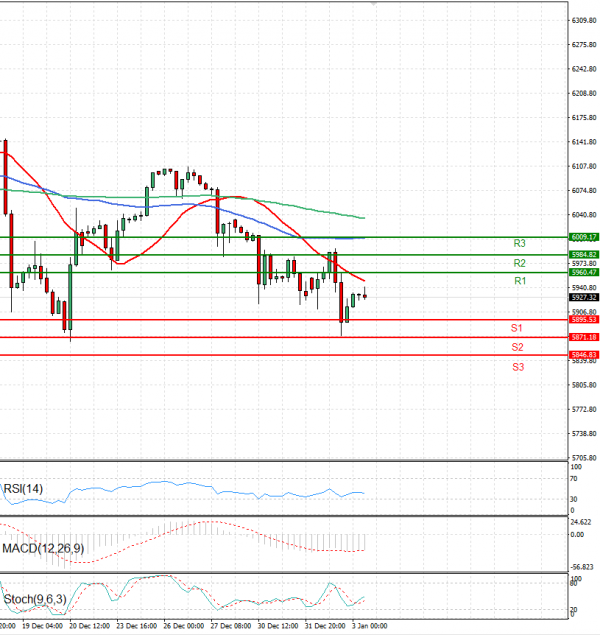
The USA500 is currently trading above 5,900 levels.

U.S. stock index futures rose Friday, closing the first volatile week of the new year on a positive note as traders look forward to the presidential inauguration on January 20th.

The S&P 500 increased 0.26%, the Dow was up 0.20% and the Nasdaq climbed 0.38%.

Technical analysis

USA500 Analysis Technical analysis 03/01/2025
Time Frame: 1 hour

USA500 Support & Resistance Table - 03/01/2025

Support & Resistance Level Explanation
Resistance 2 5984.82 Daily R2
Resistance 1 5960.47 Daily R1
Support 1 5895.53 Daily S1
Support 2 5871.18 Daily S2

USA500 Indicator Table - 03/01/2025

Indicator Signal
SMA 20 Sell
SMA 50 Sell
SMA 100 Sell
MACD( 12;26;9) Sell
RSI (14) Sell
Stochastic ( 9;6;3) Buy

USA500 Indicator / Period Table - 03/01/2025

Indicator / Period Day - SellWeek - BuyMonth - Buy
MACD( 12;26;9) Sell BuyBuy
RSI (14) Sell BuyBuy
SMA 20 Sell BuyBuy

USA500 03/01/2025 - Reference Price : 5927.32

Sell
Simple Moving AverageBuy (0)Sell (3)
Technical Indicators - OscillatorsBuy (1)Sell (2)
Share It With Your Network
USA500 Chart
Update Time: -
Highest
Lowest
1M 5M H D W
Prices are loading..
Ready for trading?Start Now