CFDs are complex instruments and come with a high risk of losing money rapidly due to leverage. 71% of retail investor accounts lose money when trading CFDs with this provider. You should consider whether you understand how CFDs work and whether you can afford to take the high risk of losing your money.
CFDs are complex instruments and come with a high risk of losing money rapidly due to leverage. 70.41% of retail investor accounts lose money when trading CFDs with this provider. You should consider whether you understand how CFDs work and whether you can afford to take the high risk of losing all your money. Read full risk warning.

Crude Oil Analysis

EU Session Analysis for CFD Instruments 01/04/2021

Fundamental analysis

01 April, 2021

Crude prices rose on Thursday, recouping some of the previous session’s losses on expectations that a meeting of OPEC and its allies later on Thursday would yield output constraint in the face of resurgent COVID-19 infections in some regions. Ministers from the Organization of the Petroleum Exporting Countries (OPEC) and allies including Russia and Kazakhstan, a group called OPEC+, meet later on Thursday to consider options that include an output roll-over and a gradual output increase. A lowering of the OPEC+ oil demand growth forecast for this year by 300,000 barrels per day (bpd) also weighed on prices and made it more likely the meeting would result in continued restraint. On Wednesday, the Joint Technical Committee, which advises the group of oil-producing nations that includes Saudi Arabia and Russia, made no formal recommendation, three OPEC+ sources said. OPEC+ is currently curbing output by just over 7 million bpd to support prices and reduce oversupply. Saudi Arabia has added to those cuts with a further 1 million bpd. The EIA Weekly Inventory report showed Crude Oil inventories declining 876,000 barrels last week. The consensus forecast was for an increase of 107,000 barrels.
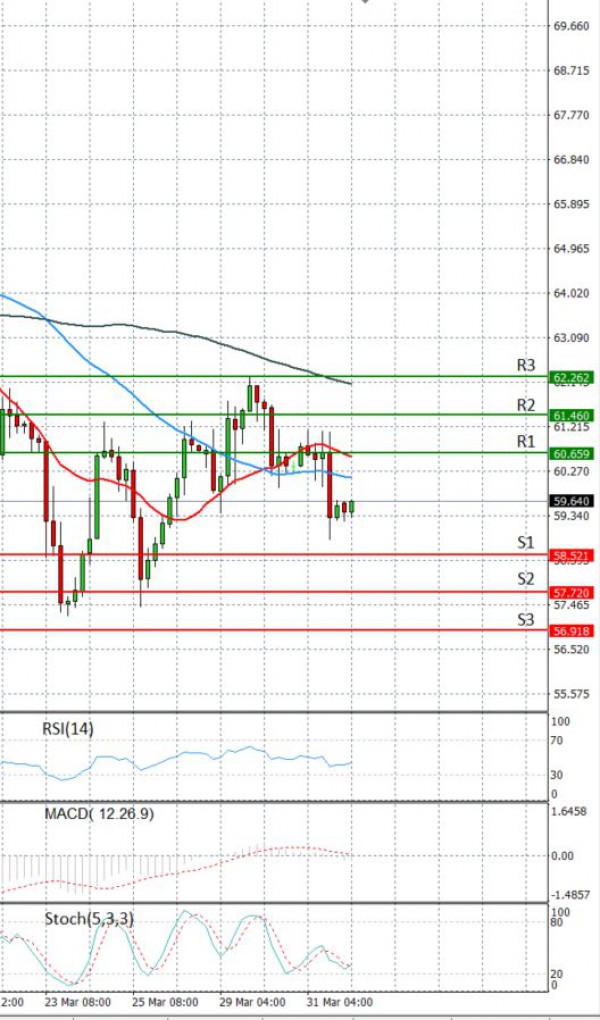
Technical analysis

Crude Oil Analysis Technical analysis 01/04/2021
Time Frame: 1 hour

CRUDEOIL Support & Resistance Table - 01/04/2021

Support & Resistance Level Explanation
Resistance 2 61.460 Daily R2
Resistance 1 60.659 Daily R1
Support 1 58.521 Daily S1
Support 2 57.720 Daily S2

CRUDEOIL Indicator Table - 01/04/2021

Indicator Signal
SMA 20 Sell
SMA 50 Sell
SMA 100 Sell
MACD( 12;26;9) Neutral
RSI (14) Sell
Stochastic ( 9;6;3) Sell

CRUDEOIL Indicator / Period Table - 01/04/2021

Indicator / Period Day - SellWeek - SellMonth - Buy
MACD( 12;26;9) Neutral SellBuy
RSI (14) Sell NeutralBuy
SMA 20 Sell BuyBuy

CRUDEOIL 01/04/2021 - Reference Price : 59.590

Sell
Simple Moving AverageBuy (0)Sell (3)
Technical Indicators - OscillatorsBuy (0)Sell (2)
Share It With Your Network
Crude OIL Chart
Update Time: -
Highest
Lowest
1M 5M H D W
Prices are loading..
Ready for trading?Start Now